jQuery Plugin To Generate Animated & Customizable Gauges - Flex Gauge
| File Size: | 9.29 KB |
|---|---|
| Views Total: | 10722 |
| Last Update: | |
| Publish Date: | |
| Official Website: | Go to website |
| License: | MIT |
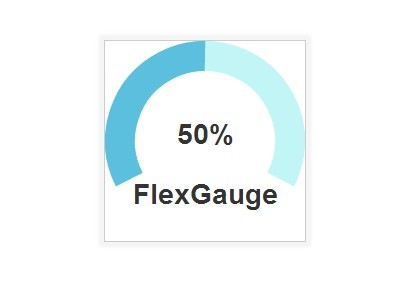
Flex Gauge is a powerful jQuery plugin to draw animated & highly customizable gauges using Html5 canvas element.
How to use it:
1. Load the jQuery flex gauge plugin after loading jQuery library.
<script src="//ajax.googleapis.com/ajax/libs/jquery/2.1.1/jquery.min.js"></script>
<script src="FlexGauge.js"></script>
2. Create an empty element that will be served as a gauge container.
<div id="demo">

</div>
3. The Javascript to generate a basic gauge appending to the element you just created.
var gauge = new FlexGauge({
appendTo: '#demo'
});
4. Available settings to customize the gauge.
appendTo: 'body': {String} Element that you would like to append to. ie '#idname', '.classname', 'div#idname', etc..elementId: 'canvas': Id of Canvas already created or Id of canvas that will be created automaticallyelementClass: 'canvas': Class of canvas createdelementWidth: 200: Canvas WidthelementHeight: 200: Canvas HeightdialValue: false: Generate Dial Value for the Gauge, true will use arcFillPercent or arcFillInt depending on provided values and specified dialUnits, string will use specified valuedialClass: 'fg-dial': Class applied to div when dial is generated.dialUnit: '%': Type of unit to use for the dial. string: %|$|dialUnitPosition: 'after': Where the dial unit will be displayed.{string: before|after}dialLabel: false: Generate Label for the Gauge, true will use default "FlexGauge", string will use specifieddialLabelClass: 'fg-dial-label': Class applied to div when label is generated.arcSize: 85: Radius of the arcarcAngleStart: 0.85: Starting location of the arc, End always needs to be largerarcAngleEnd: 2.15: Ending location of the arc, End always needs to be largerarcFillPercent: .5: Percentage the arc fillsarcFillStart: null: Starting values that are used toarcFillEnd: null: Ending values that are used to. ie: 60 (arcFillEnd) - 10 (arcFillStart) = 50arcFillInt: null: Data used to find out what percentage of the arc to fill. arcFillInt can be populated by the difference of arcFillStartarcFillTotal: null: Data used to find out what percentage of the arc to fill. arcFillInt can be populated by the difference of arcFillEndarcBgColorLight: 80: Color lightness: 0 - 255, 0 having no white added, 255 having all white and no colorarcBgColorSat: 60: Color saturation: 0 - 100, 0 having no color, 100 is full colorarcStrokeFg: 30: Size of the line marking the percentagearcStrokeBg: 30: Size of the container holding the linecolorArcFg: '#5bc0de': Color of the line marking the percentagecolorArcBg: null: Color of the container holding the line, default is using the Fg color and lightening itstyleArcFg: null: Instead of providing a color or hex for the color, you can provide a class from the stylesheet and specify what you would like to grab for the color in styleSrcstyleArcBg: null,styleSrc: 'color',animateEasing: true: If set to false, then the graph will not be animatedanimateSpeed: 5: Speed for the animation, 1 is fastest, higher the number, slower the animationanimateNumerator: 12: Math used in animation speedanimateDivisor: 15,_animatePerc: 0.00: Placeholder for current percentage while animating_animateLoop: null: Placeholder for setInterval_canvas: null: Placeholder for canvas_ctx: null: Placeholder for canvas context
This awesome jQuery plugin is developed by jeffmillies. For more Advanced Usages, please check the demo page or visit the official website.