10 Best jQuery & JavaScript Gauge Charts For Dashboards (2026 Update)
A gauge chart help you display metrics, performance indicators, and progress values in circular or semi-circular dial formats. This type of chart appear in dashboards, monitoring systems, analytics platforms, and control panels across web applications.
This article ranks the 10 best JavaScript and jQuery gauge libraries for 2026. We evaluated each library using three criteria: GitHub stars (community adoption), update activity (maintenance status), and traffic on our website over the past year (developer interest). The list includes options for jQuery developers, vanilla JavaScript projects, and pure CSS implementations.
Browse the rankings below to find the best gauge chart that matches your project requirements.
Originally Published May 18 2019, updated Dec 12 2025
Table of contents:
Best jQuery Gauge Plugins:
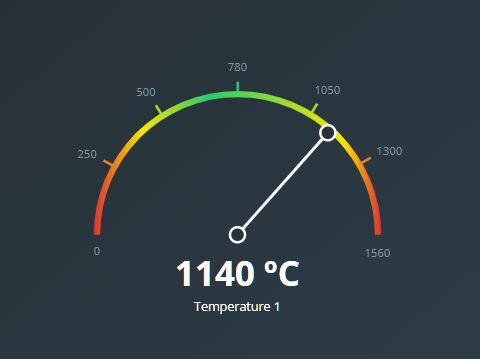
Graphical Gauge Meter With jQuery and Dx.js
An elegant, animated, graphical gauge meter/chart that uses jQuery and dx.js libraries for SVG drawing.
Customizable & Animated jQuery / HTML5 Gauge Meter Plugin
GaugeMeter.js is a versatile jQuery gauge plugin which takes advantage of HTML5 canvas to render animated gauge meters and dials with plenty of customization options.
Features:
- Canvas based. No png or jpg required.
- Simple and lightweight (~6kb).
- Highly customizable and styleable.
- 16 built-in themes.
- Custom legends & labels.
- Displays either a full circle, semi-circle or an arched-circle.
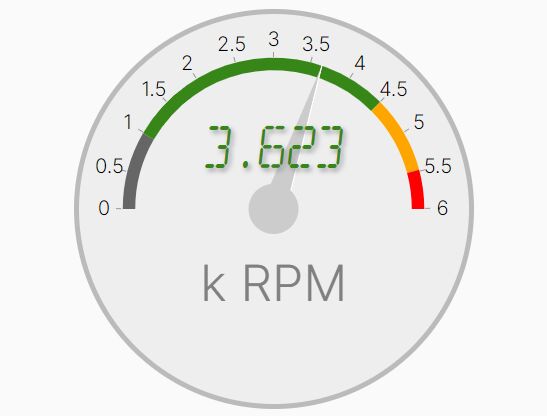
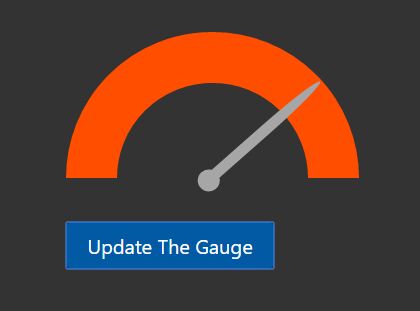
Analog/Digital Gauge Plugin - jQuery simplegauge.js
A simple-to-use jQuery plugin that uses SVG and JavaScript to draw customizable Analog Gauges or Digital Gauges on the page.
Minimal Gauge Plugin With jQuery And CSS3 - cmGauge
A jQuery plugin which lets you create a minimal clean gauge widget to present the percentage value using pure JavaScript and CSS. Allows to smoothly update the gauge using CSS3 transitions and transforms.
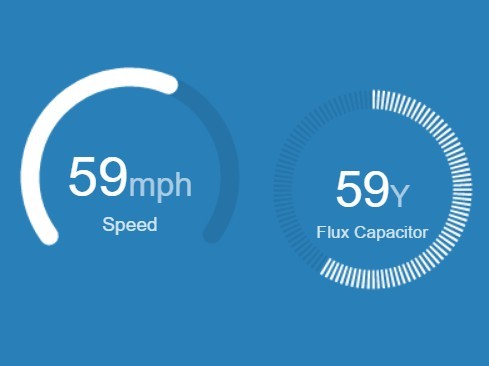
Speedometer Style Progress Gauge With jQuery And CSS3
A speedometer style circular progress gauge to represent the current progress in percentage. Written in JavaScript (jQuery) and CSS/CSS3.
Best Vanilla JS Gauge Libraries:
Gauge.js
A powerful JavaScript library to render customizable, animated gauges on an HTML5 canvas element.

Canvas Based HTML5 Gauge Library – Gauge.js
A pure JavaScript library used to generate animated, dynamic, highly configurable linear/radial gauges using HTML5 canvas element.

Create Animated Gauges With JavaScript – SVG Gauge
SVG Gauge is a dependency-free JavaScript library for drawing customizable, animated gauges using JavaScript and SVG.

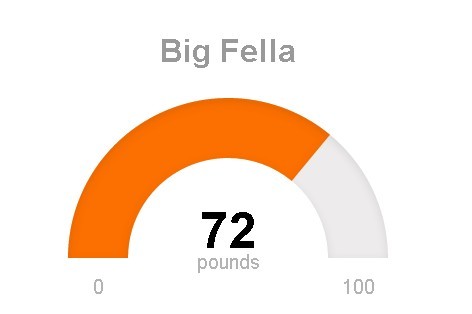
Animated Gauge Plugin In JavaScript - JustGage
JustGage is a JavaScript plugin for generating and animating nice & clean gauges. It is based on Raphaël library for vector drawing, so it’s completely resolution independent and self-adjusting.
Features:
- Zero Dependencies: Runs entirely on native browser SVG APIs without requiring RaphaelJS or any other external library.
- Multiple Gauge Styles: Supports standard arc gauges, full donut circles, and differential gauges that fill from center rather than minimum value.
- Dynamic Value Updates: Refresh gauge values with smooth animations and configurable easing functions.
- Customization Options: Control colors, fonts, shadows, pointer styles, target lines, and sector-based color ranges.
- Responsive Sizing: Gauges automatically adjust to container dimensions when relativeGaugeSize is enabled.
- Human-Friendly Number Formatting: Converts large numbers like 1,234,567 to readable formats like 1.23M.
- Out-of-Bounds Display: Shows values that exceed the configured min/max range without breaking the visualization.
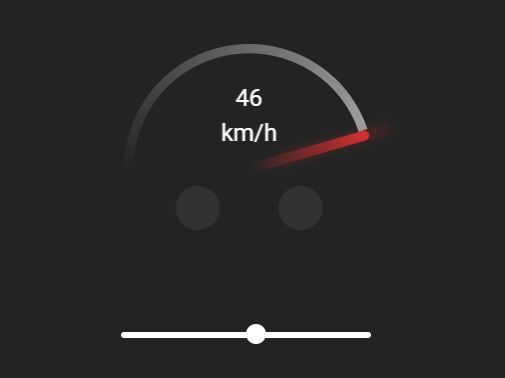
Minimal JavaScript Gauge Library: No SVG/Canvas
A lightweight JavaScript library that creates minimal, clean, smooth gauges using only HTML, JavaScript, and CSS. You don’t need SVG or Canvas, which keeps things light and fast.
This library provides a simple way to represent numeric data visually. You can use it to display progress bars, visualize sensorgau data, or create interactive dashboards. For example, a fitness application could show daily activity levels using gauge charts to present exercise progress. A financial dashboard might use a gauge chart to visualize budget spending against a predefined limit.

Bonus: Pure CSS Gauge:
Creating Fast and Responsive Gauges with Pure CSS
A pure CSS solution to create pretty, fast and responsive bar gauges which can be used for counter, progress bar, or anything else.

Which JavaScript Gauge Library Should You Use?
For jQuery projects: Use GaugeMeter.js (extensive themes and customization) or cmGauge (minimal implementation).
For zero-dependency projects: Choose JustGage (actively maintained, no external libraries).
For canvas rendering: Select Gauge.js library for canvas-based implementation.
For SVG preference: Pick SVG Gauge for resolution-independent graphics.
For minimal bundle size: Use the Minimal JavaScript Gauge Library or Pure CSS Gauge (bonus).
For multiple gauge styles: Choose JustGage for arc, donut, and differential gauge options.
For analog/digital displays: Use jQuery simplegauge.js.
Can't find the perfect plugin?
Instead of settling for legacy code, build exactly what your project needs in seconds. Discover the 10 Best Free AI Tools for Frontend Developers and let AI write the boilerplate for you.
FAQs:
Q: What is a JavaScript Gauge Library?
A: A JavaScript gauge library provides pre-built components for rendering gauge meters, dial charts, and speedometer-style visualizations in web applications. You can use these libraries to display metrics, progress indicators, performance data, and measurement values in circular or semi-circular formats.
Q: How do I choose between Canvas, SVG, and CSS gauge libraries?
A: Canvas gauges perform better with complex animations and frequent updates. SVG gauges scale perfectly at any resolution and integrate well with DOM manipulation. CSS gauges have the smallest file size and fastest initial render but offer less flexibility. Choose Canvas for dynamic dashboards, SVG for static or moderately dynamic displays, and CSS for simple progress indicators.
Q: Can I use gauge libraries in React, Vue, or Angular projects?
A: Yes. All vanilla JavaScript gauge libraries work in modern frameworks. Initialize the gauge in the appropriate lifecycle method (React useEffect, Vue mounted, Angular ngAfterViewInit).
Q: What are the performance considerations for gauge libraries?
A: Canvas-based gauges consume more memory but render complex animations faster. SVG gauges use less memory for simple displays but slow down with many simultaneous animations. CSS gauges have minimal performance impact. For dashboards with 10+ gauges, test your chosen library with realistic data. Consider lazy loading gauges below the fold.
More Resources:
Looking for more jQuery plugins or JavaScript libraries to create awesome gauges on the web & mobile? Check out the jQuery Gauge and JavaScript/CSS Gauge sections.