Multi-purpose Radial Bars With jQuery And SVG - ratePoint
| File Size: | 24.5 KB |
|---|---|
| Views Total: | 1372 |
| Last Update: | |
| Publish Date: | |
| Official Website: | Go to website |
| License: | MIT |
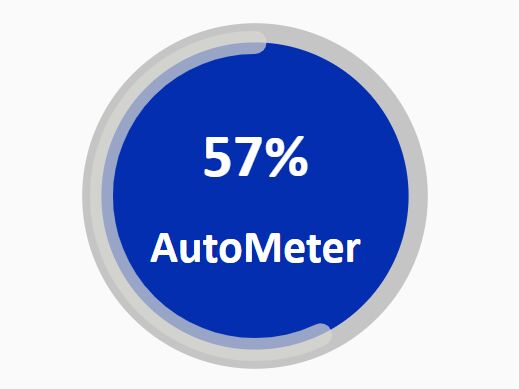
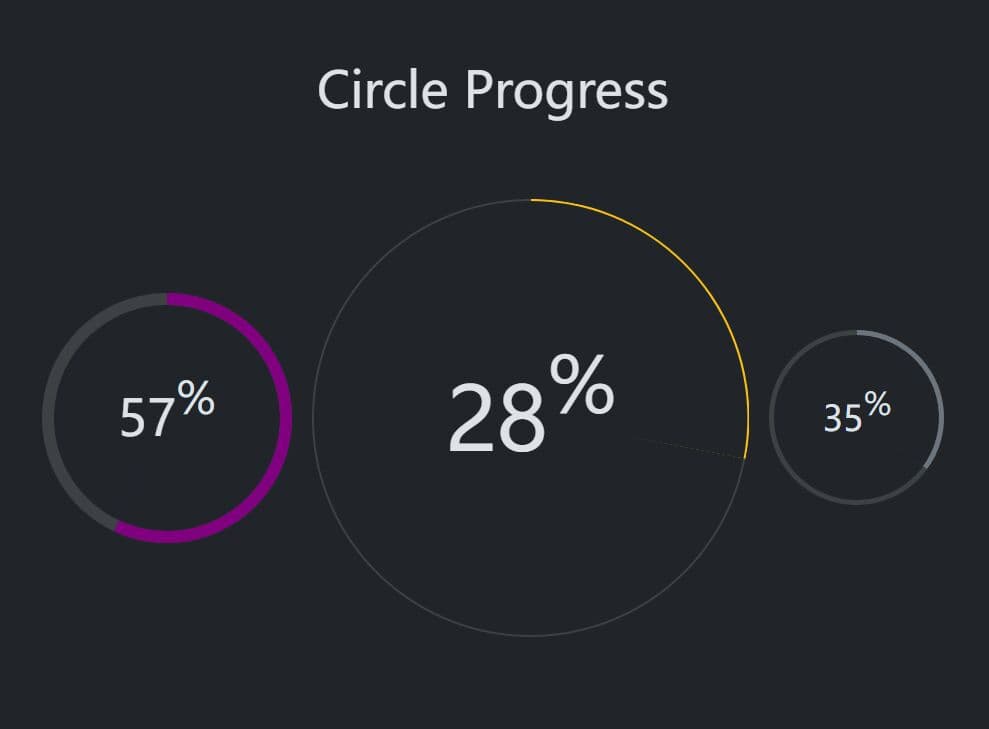
ratePoint is a jQuery plugin that utilizes JavaScript and SVG to generate animated and customizable circles for representing percentage values and arbitrary numbers.
See Also:
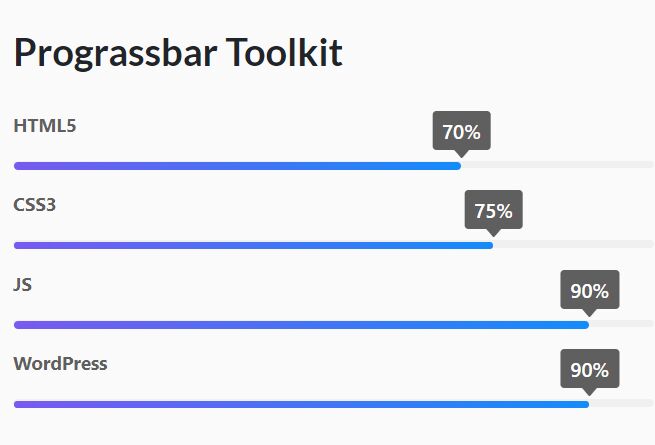
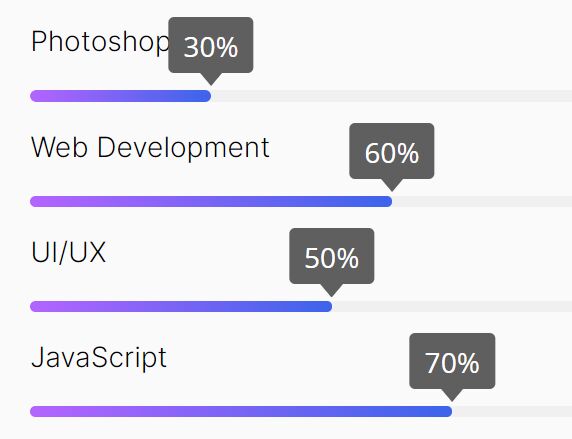
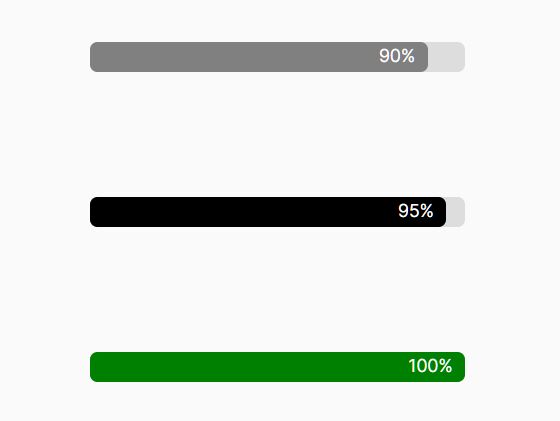
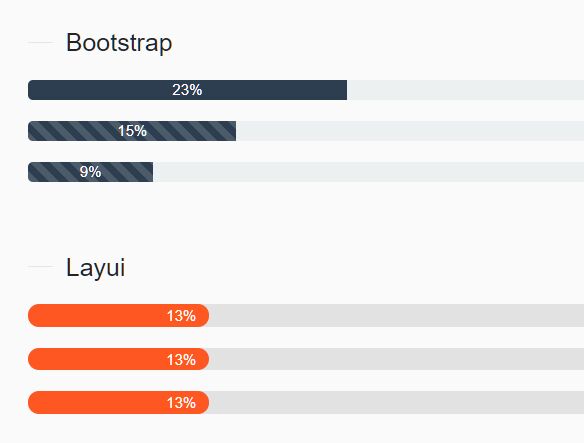
- 10 Best Progress Bar (Linear) Components In JavaScript & CSS
- 10 Best Circular/Radial Progress Bar JavaScript Plugins
- 10 Best Progress Bar Components For Vue.js App
- 10 Best JavaScript & CSS Progress Bar Components
How to use it:
1. Insert jQuery library and the ratePoint.js plugin into the document.
<link rel="stylesheet" href="/path/to/css/radial-themes.css" />
<script src="/path/to/cdn/jquery.min.js"></script>
<script src="/path/to/js/ratePoint.js"></script>
2. Initialize the plugin.
autoRatePoint();
3. Create an SVG element for the radial bar and config the plugin via the following data attributes:
- data-func: Required
- data-start: Start value
- data-end: End value
- data-mark: Custom mark
- data-unit: Custom unit
- data-time: Duration of animation
- data-label: Custom label
- data-angle: Start angle
- data-split: Split layout
- data-mirror: "x", "y", "x,y", or "y,x"
- data-bkpoints: Breakpoints
- data-bkclass: Corresponding CSS classes
- data-bkcolors: Corresponding colors
- data-run: Auto run on page load
<svg id="animated" class='' data-toggle="class" viewbox="0 0 100 100 " xmlns="http://www.w3.org/2000/svg ">
  <circle class='no-fil' cx="50 " cy="50 " r="45 "/>
  <item data-func="prodata"
        data-start="0 "
        data-end="75 "
        data-mark="100 "
        data-unit='%'
        data-time="7000 "
        data-label="<span class='grid-center font8 font-all'>AutoMeter</span>"
        data-angle="0"
        data-mirror="x"
        data-bkpoints="0 20 50 70 100"
        data-bkclass="low normal medium high complete"
        data-run="auto">
      </item>
  <path id="1" class="bar6 cap-round" data-func="progressbar" stroke-linecap="round" stroke-dasharray="0,251.36264038085938" stroke-width="1" d="M50 10 a 30 30 0 0 1 0 80 a 30 30 0 0 1 0 -80">
  </path>
  <foreignObject data-func="protext" x="20" y="20" height="60%" width="60%" text-anchor="middle" dy="7" class="text-center"></foreignObject>
</svg>
4. This example shows how to automatically update the radial bar.
let datas = [10, 50, 30, 70, 45, 10];
    i = 0;
    instance = 0;
    elem = "#1"
    setInterval(function() {
        let path = $(elem).find("path"),
            prodata = $(elem).find("[data-func='prodata']");
        //dataStart = (dataStart / dataMark) * 100;
        dataStart = path.attr('data-point') ? $(elem).find("path").attr('data-point') : 0;
        dataMark = prodata.attr('data-mark');
        dataStop = datas[i];
        prodata.attr({
            "data-start": dataStart,
            "data-end": dataStop
        });
        console.log(dataStart)
        setTimeout(function() {
            autoRatePoint("#1")
        }, 200);
        if (i == datas.length) {
            i = 0;
            instance = 0;
        }
        i++;
        instance = 1;
}, 10000)
This awesome jQuery plugin is developed by teymzz. For more Advanced Usages, please check the demo page or visit the official website.