Basic Line Chart Plugin with jQuery and Canvas - linechart.js
| File Size: | 4.16 KB |
|---|---|
| Views Total: | 4505 |
| Last Update: | |
| Publish Date: | |
| Official Website: | Go to website |
| License: | MIT |
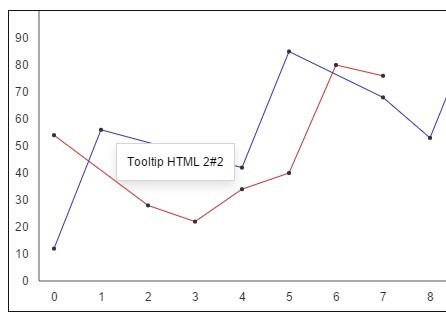
A really simple jQuery plugin to draw a canvas based line chart on your webpage that features html tooltip, multiple data lines, and dots click / hover functions.
How to use it:
1. Include jQuery library and the jQuery linechart.js script on your html page.
<script src="//code.jquery.com/jquery-2.1.4.min.js"></script>
<script src="linechart.js"></script>
2. Draws a line chart with custom datasets on an html5 canvas element.
$.linechart({
    id: 'test',
    data: [
        [
            {
                X: 0,
                Y: 54,
                tip: 'Tooltip HTML 1#1'
            }, {
                X: 2,
                Y: 28,
                tip: 'Tooltip HTML 1#2'
            }, {
                X: 3,
                Y: 22,
                tip: 'Tooltip HTML 1#3'
            }, {
                X: 4,
                Y: 34,
                tip: 'Tooltip HTML 1#4'
            }, {
                X: 5,
                Y: 40,
                tip: 'Tooltip HTML 1#5'
            }, {
                X: 6,
                Y: 80,
                tip: 'Tooltip HTML 1#6'
            }, {
                X: 7,
                Y: 76,
                tip: 'Tooltip HTML 1#7'
            }
        ], [
            {
                X: 0,
                Y: 12,
                tip: 'Tooltip HTML 2#1'
            }, {
                X: 1,
                Y: 56,
                tip: 'Tooltip HTML 2#2'
            }, {
                X: 4,
                Y: 42,
                tip: 'Tooltip HTML 2#3'
            }, {
                X: 5,
                Y: 85,
                tip: 'Tooltip HTML 2#4'
            }, {
                X: 7,
                Y: 68,
                tip: 'Tooltip HTML 2#5'
            }, {
                X: 8,
                Y: 53,
                tip: 'Tooltip HTML 2#6'
            }, {
                X: 9,
                Y: 96,
                tip: 'Tooltip HTML 2#7'
            }
        ]
    ]
});
3. Full configurable options.
// id given to the chart
id: '',

 // data arrays
data: [
  [
    { X: 0, Y: 54, tip: 'Tooltip HTML 1#1' },
    { X: 2, Y: 28, tip: 'Tooltip HTML 1#2' },
    { X: 3, Y: 22, tip: 'Tooltip HTML 1#3' }
  ]
],

// grid color
gridColor: '#555555',

// grid texts font properties
gridFont: 'normal 11px Arial',

// grid texts font color
gridFontColor: '#333333',

// grid horizontal space between values
gridPaddingX: 30,

// grid vertical space between values
gridPaddingY: 30,

// grid width
gridWidth: 1,

// dots hover function
dotsHover: function(dot){},

// dots click function
dotsClick: function(dot){},

// dots color
dotsColor: '#333333',

// dots width (radius)
dotsWidth: 2,

// lines colors
linesColors: [['#CC3333'],['#3333CC']],

// lines width
linesWidth: 2,

// tooltip horizontal margin from cursor
tooltipMarginX: 15,

// tooltip vertical margin from cursor
tooltipMarginY: 15
This awesome jQuery plugin is developed by damienvingrief. For more Advanced Usages, please check the demo page or visit the official website.