COVID-19 Map Of Cases And Deaths Around The World - COVID-19 Dashboard
| File Size: | 1.44 MB |
|---|---|
| Views Total: | 1330 |
| Last Update: | |
| Publish Date: | |
| Official Website: | Go to website |
| License: | MIT |
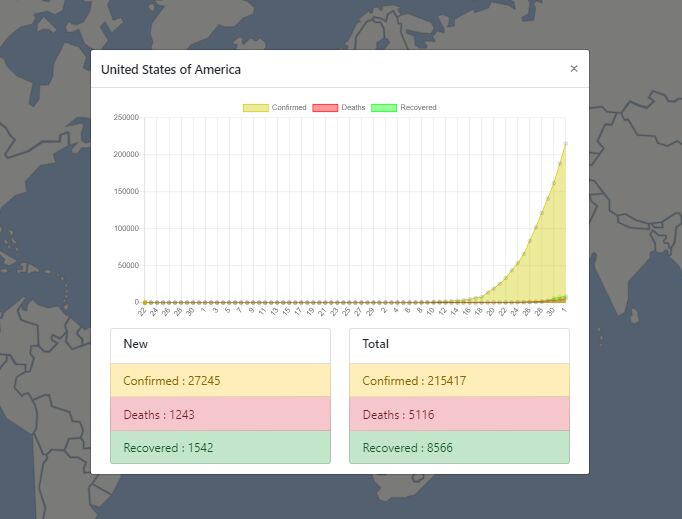
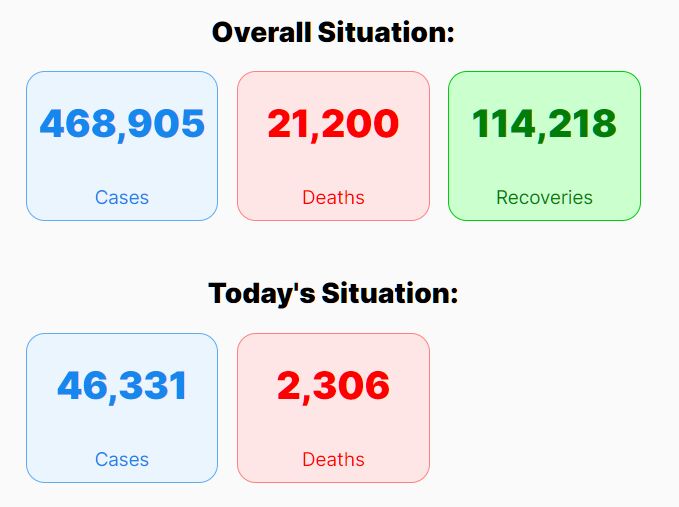
A COVID-19 dashboard that consists of a world map of confirmed COVID-19 cases, deaths, recovered patients around the world and a World Wide Statistics widget showing the latest data in a bar chart.
Dependencies:
- Bootstrap 4 framework.
- jqvmap: jQuery Vector Map Plugin.
- axios: Promise based HTTP client for the browser and node.js.
- Chart.js: Simple HTML5 Chart library.
- covid19api: A free API for data on the Coronavirus.
How to use it:
1. Load the necessary JavaScript and CSS files in your HTML document.
<!-- Stylesheet -->
<link href="/path/to/dist/jqvmap.css" rel="stylesheet" />
<link rel="stylesheet" href="/path/to/cdn/bootstrap.min.css" />

<!-- JavaScript -->
<script src="/path/to/cdn/jquery.min.js"></script>
<script src="/path/to/dist/jquery.vmap.js"></script>
<script src="/path/to/dist/maps/jquery.vmap.world.js"></script>
<script src="/path/to/cdn/axios.min.js"></script>
<script src="/path/to/js/jquery.vmap.sampledata.js"></script>
<script src="/path/to/cdn/chart.js"></script>
<script src="/path/to/cdn/popper.min.js"></script>
<script src="/path/to/cdn/bootstrap.min.js"></script>
2. Build the HTML for the COVID-19 dashboard.
<div id="loader" style="display: flex; justify-content: center;"> <div class="spinner-grow text-muted mt-3"></div> <div class="spinner-grow text-primary mt-3"></div> <div class="spinner-grow text-success mt-3"></div> <div class="spinner-grow text-info mt-3"></div> <div class="spinner-grow text-warning mt-3"></div> <div class="spinner-grow text-danger mt-3"></div> <div class="spinner-grow text-secondary mt-3"></div> <div class="spinner-grow text-dark mt-3"></div> <div class="spinner-grow text-light mt-3"></div> </div> <!-- Modal --> <div class="modal fade" id="alert-modal" tabindex="-1" role="dialog" aria-labelledby="" aria-hidden="true" > <div class="modal-dialog modal-dialog-centered modal-lg" role="document"> <div class="modal-content"> <div class="modal-header"> <h5 class="modal-title" id="modal-title"></h5> <button type="button" class="close" data-dismiss="modal" aria-label="Close" > <span aria-hidden="true" id="modal-body">×</span> </button> </div> <div class="modal-body"> <div class="container-fluid"> <div class="row"> <div class="col-md-12"> <div id="region-stat-chart-container"> <canvas id="region-stat-chart"></canvas> </div> </div> </div> </div> <div class="container-fluid"> <div class="row"> <div class="col-md-6"> <ul class="list-group"> <li class="list-group-item"> <h6>New</h6> </li> <li class="list-group-item list-group-item-warning" id="region-new-confirmed" ></li> <li class="list-group-item list-group-item-danger" id="region-new-deaths" ></li> <li class="list-group-item list-group-item-success" id="region-new-recovered" ></li> </ul> </div> <div class="col-md-6"> <ul class="list-group"> <li class="list-group-item"> <h6>Total</h6> </li> <li class="list-group-item list-group-item-warning" id="region-total-confirmed" ></li> <li class="list-group-item list-group-item-danger" id="region-total-deaths" ></li> <li class="list-group-item list-group-item-success" id="region-total-recovered" ></li> </ul> </div> </div> </div> </div> </div> </div> </div>
3. The JavaScript to enable the COVID-19 dashboard.
// API and Map
var loaded = false;
var allCountrySummary = [];
var totalInformation = {
  totalConfirmed: 0,
  totalDeaths: 0,
  totalRecovered: 0
};

const processAPIData = data => {
  allCountrySummary = data.Countries;

  allCountrySummary.forEach(country => {
    totalInformation.totalConfirmed += country.TotalConfirmed;
    totalInformation.totalDeaths += country.TotalDeaths;
    totalInformation.totalRecovered += country.TotalRecovered;
  });
};

const showRegionResultText = result => {
  $("#region-new-confirmed").text(`Confirmed : ${result.NewConfirmed}`);
  $("#region-new-deaths").text(`Deaths : ${result.NewDeaths}`);
  $("#region-new-recovered").text(`Recovered : ${result.NewRecovered}`);
  $("#region-total-confirmed").text(
    `Confirmed : ${result.TotalConfirmed}`
  );
  $("#region-total-deaths").text(`Deaths : ${result.TotalDeaths}`);
  $("#region-total-recovered").text(
    `Recovered : ${result.TotalRecovered}`
  );
};

const removeLoaderAndShowMap = () => {
  $("#loader").hide();
  $("body").append($("<div>").attr("id", "vmap"));
  $("#vmap").vectorMap({
    map: "world_en",
    enableZoom: true,
    showTooltip: true,
    onResize: function(element, width, height) {
      console.log("Map Size: " + width + "x" + height);
    },
    onRegionClick: function(element, code, region) {
      console.log(code);
      let result = allCountrySummary.find(item => {
        return (
          item["Country"] === region ||
          item["Country"].toLowerCase() === code
        );
      });
      console.log(result);
      if (result !== undefined) {
        showRegionResultText(result);
        $("#modal-title").text(region);
        $("#alert-modal").modal("show");
        fetchAndDisplay(result["Slug"]);
      }
    }
  });
};

$(() => {
  axios
    .get("https://api.covid19api.com/summary", null)
    .then(res => {
      processAPIData(res.data);
      loaded = true;
      removeLoaderAndShowMap();
      showStatistics();
    })
    .catch(err => {
      console.err(err);
    });
});

// Statistics chart
const buildStatisticsList = () => {
      return $("<ul>")
        .addClass("list-group mt-3 mb-2")
        .append(
          $("<li>")
            .addClass("list-group-item")
            .append(
              $("<h3>")
                .addClass("text-center")
                .text("Statistics")
            ),
          $("<li>")
            .addClass("list-group-item list-group-item-warning")
            .text(`Total Confirmed : ${totalInformation.totalConfirmed}`),
          $("<li>")
            .addClass("list-group-item list-group-item-danger")
            .text(`Total Deaths : ${totalInformation.totalDeaths}`),
          $("<li>")
            .addClass("list-group-item list-group-item-success")
            .text(`Total Recovered : ${totalInformation.totalRecovered}`)
        );
    };
const showStatistics = () => {
      let list = buildStatisticsList();
      let stat = $("<div>")
        .addClass("container-fluid mt-2 mb-5")
        .append(
          $("<div>")
            .addClass("row")
            .append(
              $("<div>")
                .addClass("col-md-6")
                .append(list),
              $("<div>")
                .addClass("col-md-6")
                .append($("<canvas>").attr("id", "total-stat-chart"))
            )
        );
      $("body").append(stat);
      renderTotalStatChart(totalInformation);
};
const renderTotalStatChart = data => {
      var ctx = $("#total-stat-chart");
      var myChart = new Chart(ctx, {
        type: "horizontalBar",
        data: {
          labels: ["Total Confirmed", "Total Deaths", "Total Recovered"],
          datasets: [
            {
              label: "World Wide Statisticss",
              data: [
                data.totalConfirmed,
                data.totalDeaths,
                data.totalRecovered
              ],
              backgroundColor: [
                "rgba(255, 255, 0, 1)",
                "rgba(255, 0, 0, 1)",
                "rgba(0, 255, 0, 1)"
              ],
              borderColor: [],
              borderWidth: 1
            }
          ]
        },
        options: {
          scales: {
            yAxes: [
              {
                ticks: {
                  beginAtZero: true
                }
              }
            ]
          }
        }
      });
};

// Region wise information
const processRegionAPIData = objArr => {
      let list = [];
      Array.from(objArr).forEach(item => {
        list.push(item.Cases);
      });
      return list;
};

const processDateTimeFromAPIData = objArr => {
      let list = [];
      Array.from(objArr).forEach(item => {
        list.push(new Date(item.Date).getDate().toLocaleString());
      });
      return list;
};

const fetchAndDisplay = region => {
      let chart = generateRegionChart();
      fetchRegionData(region, chart);
};

const fetchRegionData = (region, chart) => {
      axios
        .get(
          `https://api.covid19api.com/total/country/${region}/status/confirmed`
        )
        .then(res => {
          chart.data.datasets[0].data = processRegionAPIData(res.data);
          chart.data.labels = processDateTimeFromAPIData(res.data);
          chart.update();
        })
        .catch(err => {
          console.error(err);
        });
      axios
        .get(
          `https://api.covid19api.com/total/country/${region}/status/deaths`
        )
        .then(res => {
          chart.data.datasets[1].data = processRegionAPIData(res.data);
          chart.update();
        })
        .catch(err => {
          console.error(err);
        });
      axios
        .get(
          `https://api.covid19api.com/total/country/${region}/status/recovered`
        )
        .then(res => {
          chart.data.datasets[2].data = processRegionAPIData(res.data);
          chart.update();
        })
        .catch(err => {
          console.error(err);
        });
};

const generateRegionChart = () => {
      $("#region-stat-chart").remove();
      $("#region-stat-chart-container").append(
        $("<canvas>").attr("id", "region-stat-chart")
      );
      var ctx = document.getElementById("region-stat-chart").getContext("2d");

      var myChart = new Chart(ctx, {
        type: "line",
        data: {
          labels: [],
          datasets: [
            {
              label: "Confirmed",
              data: [],
              backgroundColor: ["rgba(204, 204, 0, 0.4)"],
              borderColor: ["rgba(204, 204, 0, 1)"],
              borderWidth: 1
            },
            {
              label: "Deaths",
              data: [],
              backgroundColor: ["rgba(255, 0, 0, 0.4)"],
              borderColor: ["rgba(255, 0, 0, 1)"],
              borderWidth: 1
            },
            {
              label: "Recovered",
              data: [],
              backgroundColor: ["rgba(0, 255, 0, 0.4)"],
              borderColor: ["rgba(0, 255, 0, 1)"],
              borderWidth: 1
            }
          ]
        },
        options: {
          scales: {
            yAxes: [
              {
                ticks: {
                  beginAtZero: true
                }
              }
            ]
          }
        }
      });
      return myChart;
};
More COVID-19 Resources:
- Best Coronavirus Disease (COVID-19) Plugins For WordPress
- Best Free Coronavirus Disease (COVID-19) Design Resources
- Open Source COVID-19 (Coronavirus) Resources For Web
- Display Covid-19 Data From Around The World By Country
- Show The Latest COVID-19 Stats Using JavaScript
- COVID-19 (Coronavirus Disease) Spreading Simulation Tool In JavaScript
- Coronavirus Spreading Simulator In JavaScript
- SVG Based COVID-19 Data Badges
This awesome jQuery plugin is developed by rafiulgits. For more Advanced Usages, please check the demo page or visit the official website.