World Time Clock & Map With jQuery And Bootstrap
| File Size: | 76.8 KB |
|---|---|
| Views Total: | 5201 |
| Last Update: | |
| Publish Date: | |
| Official Website: | Go to website |
| License: | MIT |
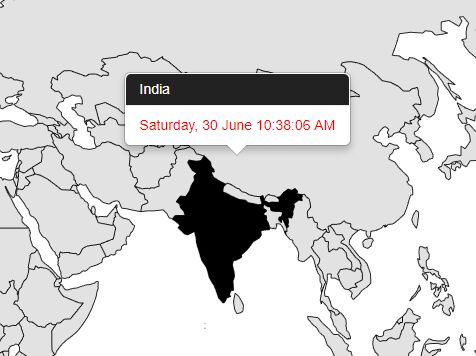
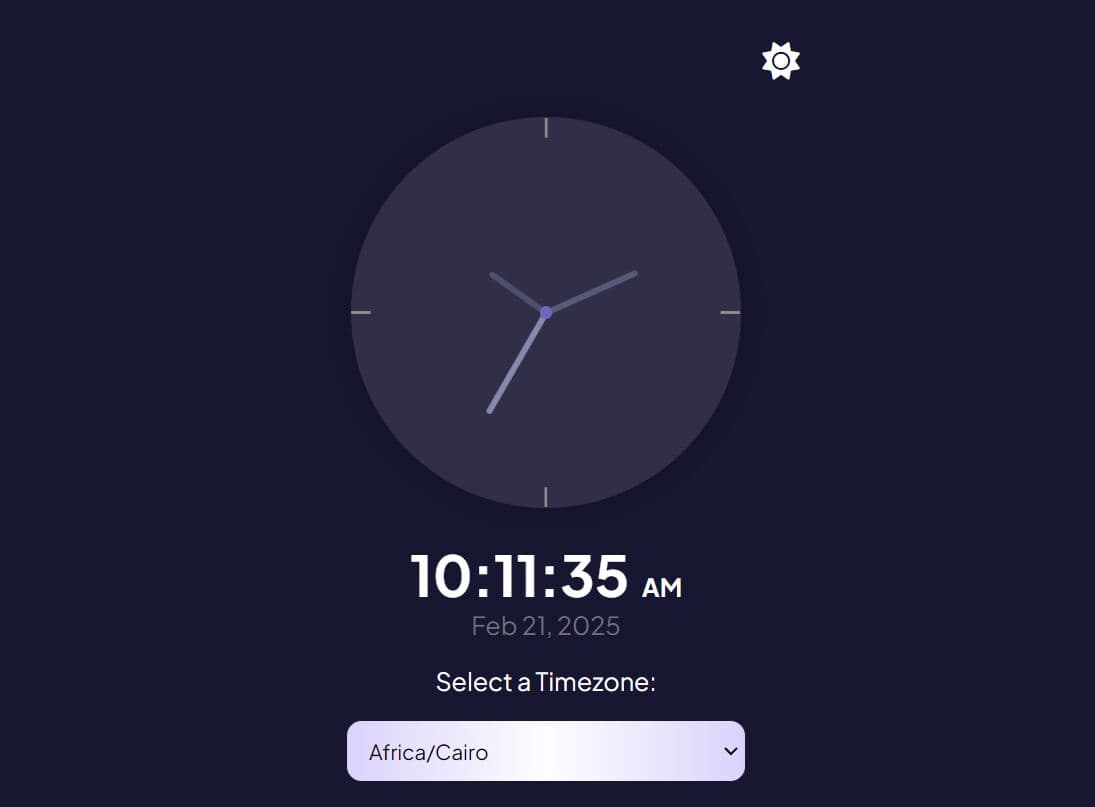
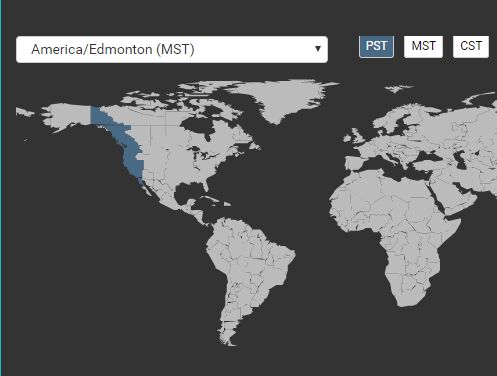
A simple yet useful World Time Clock & Map app built with jQuery library, jquery.jclock.js plugin, Bootstrap framework and SVG world map.
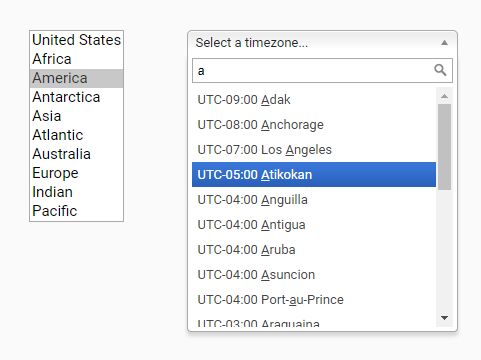
Hover over the area and you will see the current local time and date in cities countries in all time zones.
How to use it:
1. Load the necessary jQuery and other required resources in the document.
<link rel="stylesheet" href="/path/to/bootstrap.min.css">
<script src="/path/to/jquery.min.js"></script>
<script src="/path/to/bootstrap.min.js"></script>
<script src="/path/to/jquery.jclock.js"></script>
2. Create SVG maps of the world on the webpage as follows:
<input type="hidden" class="jclock" />
<?xml version="1.0" encoding="UTF-8" standalone="no"?>

<svg
   xmlns:dc="http://purl.org/dc/elements/1.1/"
   xmlns:cc="http://creativecommons.org/ns#"
   xmlns:rdf="http://www.w3.org/1999/02/22-rdf-syntax-ns#"
   xmlns:svg="http://www.w3.org/2000/svg"
   xmlns="http://www.w3.org/2000/svg"
   xmlns:sodipodi="http://sodipodi.sourceforge.net/DTD/sodipodi-0.dtd"
   xmlns:inkscape="http://www.inkscape.org/namespaces/inkscape"
   enable_background="new 0 0 2000 1001"
   height="100%"
   pretty_print="False"
   style="stroke-linejoin: round; stroke:#000; fill: none;"
   version="1.1"
   viewBox="0 0 2000 1001"
   width="100%"
   id="svg2"
   inkscape:version="0.48.4 r9939"
   sodipodi:docname="world.svg">
  <sodipodi:namedview
     pagecolor="#ffffff"
     bordercolor="#666666"
     borderopacity="1"
     objecttolerance="10"
     gridtolerance="10"
     guidetolerance="10"
     inkscape:pageopacity="0"
     inkscape:pageshadow="2"
     inkscape:window-width="1920"
     inkscape:window-height="1137"
     id="namedview231"
     showgrid="false"
     inkscape:zoom="1.144"
     inkscape:cx="593.00732"
     inkscape:cy="460.46398"
     inkscape:window-x="1192"
     inkscape:window-y="118"
     inkscape:window-maximized="1"
     inkscape:current-layer="svg2" />
  <defs id="defs4">
  </defs>
  <metadata
     id="metadata8">
    <views
       id="views10">
      <view
         h="1001"
         padding="0"
         w="2000"
         id="view12">
        <proj
           flip="auto"
           id="robinson"
           lon0="100.0" />
        <bbox
           h="2233.1"
           w="5271.17"
           x="-2635.59"
           y="-1308.06"
           id="bbox15" />
      </view>
    </views>
    <rdf:RDF>
      <cc:Work
         rdf:about="">
        <dc:format>image/svg+xml</dc:format>
        <dc:type
           rdf:resource="http://purl.org/dc/dcmitype/StillImage" />
        <dc:title />
      </cc:Work>
    </rdf:RDF>
  </metadata>


  <a class="country" id="+4.30" data-toggle="popover" data-container="body" title="Afghanistan" data-content="Some content inside the popover" data-placement="top">
  <path
     inkscape:connector-curvature="0"
     id="AF"
     data-name="Afghanistan"
     data-id="AF"
     d="m 1369.9,333.8 -5.4,0 -3.8,-0.5 -2.5,2.9 -2.1,0.7 -1.5,1.3 -2.6,-2.1 -1,-5.4 -1.6,-0.3 0,-2 -3.2,-1.5 -1.7,2.3 0.2,2.6 -0.6,0.9 -3.2,-0.1 -0.9,3 -2.1,-1.3 -3.3,2.1 -1.8,-0.8 -4.3,-1.4 -2.9,0 -1.6,-0.2 -2.9,-1.7 -0.3,2.3 -4.1,1.2 0.1,5.2 -2.5,2 -4,0.9 -0.4,3 -3.9,0.8 -5.9,-2.4 -0.5,8 -0.5,4.7 2.5,0.9 -1.6,3.5 2.7,5.1 1.1,4 4.3,1.1 1.1,4 -3.9,5.8 9.6,3.2 5.3,-0.9 3.3,0.8 0.9,-1.4 3.8,0.5 6.6,-2.6 -0.8,-5.4 2.3,-3.6 4,0 0.2,-1.7 4,-0.9 2.1,0.6 1.7,-1.8 -1.1,-3.8 1.5,-3.8 3,-1.6 -3,-4.2 5.1,0.2 0.9,-2.3 -0.8,-2.5 2,-2.7 -1.4,-3.2 -1.9,-2.8 2.4,-2.8 5.3,-1.3 5.8,-0.8 2.4,-1.2 2.8,-0.7 -1.4,-1.9 z"
     />
  </a>

  ...

</svg>
3. The main JavaScript.
$(document).ready(function(){

  $(".country").hover(function(){

    var gmt_country = $(this).attr("id");
    // alert(gmt_country);
    var options = {
        format:'<span class=\"dt\">%A, %d %B %I:%M:%S %P</span>',
        timeNotation: '12h',
        am_pm: true,
        utc:true,
        utc_offset: gmt_country
      };
      $('.jclock').jclock(options);

      var country_time = $(".jclock").text();

      // alert(country_time);

      $(this).attr("data-content", country_time);

  });

  $('[data-toggle="popover"]').popover({ trigger: "hover" });

});
This awesome jQuery plugin is developed by hakikz. For more Advanced Usages, please check the demo page or visit the official website.