Visual Tabular Data Comparison Plugin - jQuery Table Compare
| File Size: | 8.67 KB |
|---|---|
| Views Total: | 683 |
| Last Update: | |
| Publish Date: | |
| Official Website: | Go to website |
| License: | MIT |
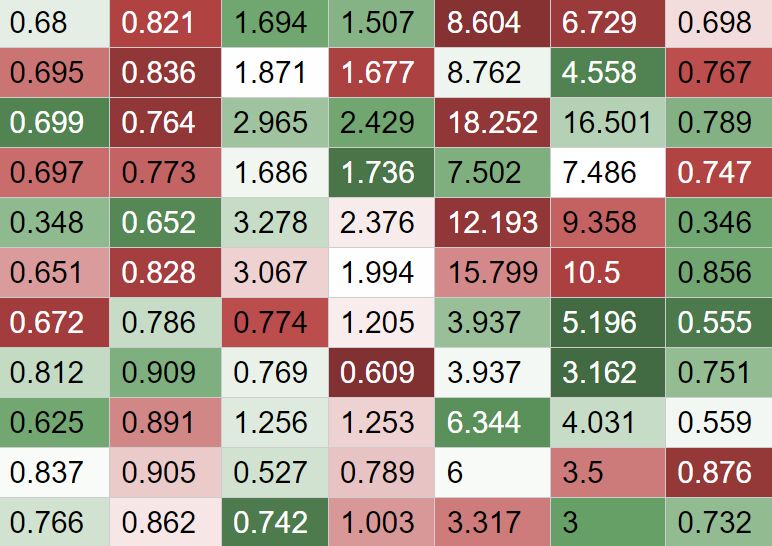
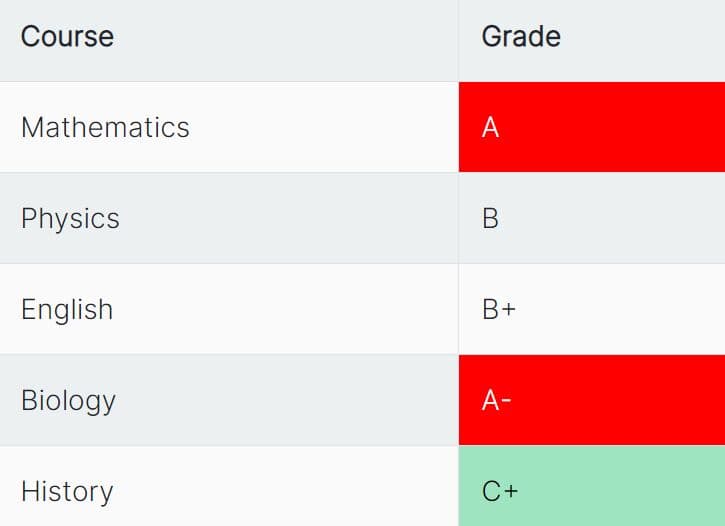
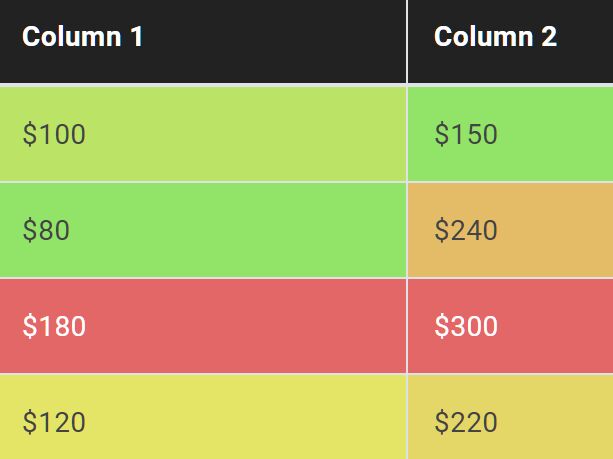
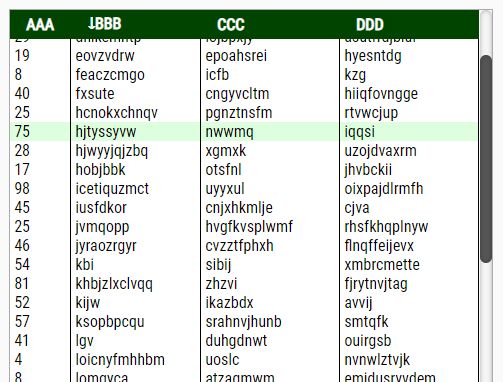
Table Compare is a tiny jQuery plugin used to show tabular data with a color mapping against a comparison table. Supports either binary (binary thresholding) or linear interpolation modes.
See Also:
- Highlight Largest/Lowest Value In Each Row Or Column - tableMinMax
- Auto Colorize Elements Based On Their Values - jQuery ColorizeJS
- Colorize Numeric Values In Table Columns - Column HeatMap
- Highlight Table Cells Based On Predefined Content - tableCellColorizer
How to use it:
1. Create an empty table element on the page.
<table id="example">
</table>
2. Prepare your tabular data.
var headers = ['Subject', 'Dice 1', 'Dice 2', 'Adb 1', 'Adb 2', 'Hdb 1', 'Hdb 2', 'Sens 1', 'Sens 2', 'Spec 1', 'Spec 2'];
var data = [
    ['averages', 0.68, 0.821, 1.694, 1.507, 8.604, 6.729, 0.698, 0.848, 0.998, 0.998],
    ['ProstateDx-03-0005', 0.695, 0.836, 1.871, 1.677, 8.762, 4.558, 0.767, 0.756, 0.998, 0.999],
    ['ProstateDx-03-0004', 0.699, 0.764, 2.965, 2.429, 18.252, 16.501, 0.789, 0.876, 0.997, 0.997],
    ['ProstateDx-03-0003', 0.697, 0.773, 1.686, 1.736, 7.502, 7.486, 0.747, 0.766, 0.998, 0.999],
    ['ProstateDx-03-0002', 0.348, 0.652, 3.278, 2.376, 12.193, 9.358, 0.346, 0.695, 0.997, 0.996],
    ['ProstateDx-03-0001', 0.651, 0.828, 3.067, 1.994, 15.799, 10.5, 0.856, 0.774, 0.994, 0.998],
    ['Prostate3T-03-0005', 0.672, 0.786, 0.774, 1.205, 3.937, 5.196, 0.555, 0.939, 1, 0.998],
    ['Prostate3T-03-0004', 0.812, 0.909, 0.769, 0.609, 3.937, 3.162, 0.751, 0.947, 0.999, 0.999],
    ['Prostate3T-03-0003', 0.625, 0.891, 1.256, 1.253, 6.344, 4.031, 0.559, 0.941, 0.999, 0.995],
    ['Prostate3T-03-0002', 0.837, 0.905, 0.527, 0.789, 6, 3.5, 0.876, 0.886, 0.999, 0.999],
    ['Prostate3T-03-0001', 0.766, 0.862, 0.742, 1.003, 3.317, 3, 0.732, 0.902, 0.999, 0.998]
];
3. Load the jQuery Table Compare plugin.
<script src="/path/to/cdn/jquery.slim.min.js"></script>
<script src="/path/to/table-compare.js"></script>
4. Initialize the plugin on the HTML table. Possible parameters:
- data: The data matrix to show. 2D array of Numbers in row-major order.
- baseline: The baseline matrix to compare against. 2D array of Numbers in row-major order; must be the same size as the data parameter. Any element that should not be compared numerically to its corresponding cell in the data array should be set to null.
- config: Configuration options.
var baselineBinary = new Array(data.length);
    baselineInterp = new Array(data.length);

// Invent some random but sensible baseline data
for (var i = 0; i < data.length; i++) {
    baselineBinary[i] = new Array(data[i].length);
    baselineInterp[i] = new Array(data[i].length);
    baselineBinary[i][0] = null;
    baselineInterp[i][0] = null;
    for (var j = 1; j < data[i].length; j++) {
        // For binary coloring, each baseline is simply the threshold
        // to distinguish between two classes.
        baselineBinary[i][j] = Math.random() * 2 * data[i][j];

        // For linear interpolation, each baseline value is a 2-tuple
        // where the first value is the baseline and the second value is the
        // slope of lightness as a function of scalar deviation from baseline.
        baselineInterp[i][j] = [Math.random() * 2 * data[i][j], 1.5*data[i][j]];
    }
}

$(function () {

  // binary mode
  $('#example').compareTable(data, baselineBinary, {
    headers: headers,
    mode: 'binary'
  });

  // linterp mode
  $('#example').compareTable(data, baselineInterp, {
    headers: headers,
    mode: 'linterp',
  });

});
5. All available configuration options.
$('#example').compareTable(data, baselineBinary, {
  headers: null,
  styleAttribute: 'backgroundColor',
  mode: 'binary',
  highColor: {r: 204, g: 119, b: 119},
  lowColor: {r: 119, g: 170, b: 119},
  nullColor: {r: 255, g: 255, b: 255},
  dynamicTextColor: false
});
This awesome jQuery plugin is developed by zachmullen. For more Advanced Usages, please check the demo page or visit the official website.