Customizable and Animated jQuery & SVG Based Graph Plugin - Graph.js
| File Size: | 27.6 KB |
|---|---|
| Views Total: | 9785 |
| Last Update: | |
| Publish Date: | |
| Official Website: | Go to website |
| License: | MIT |
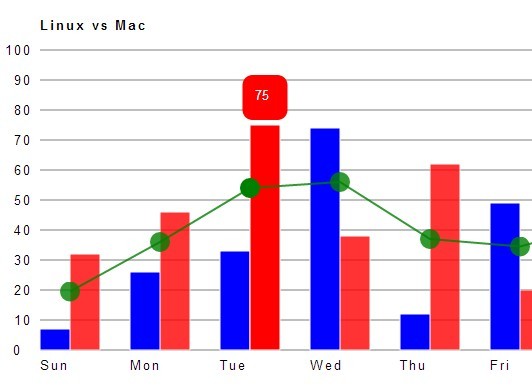
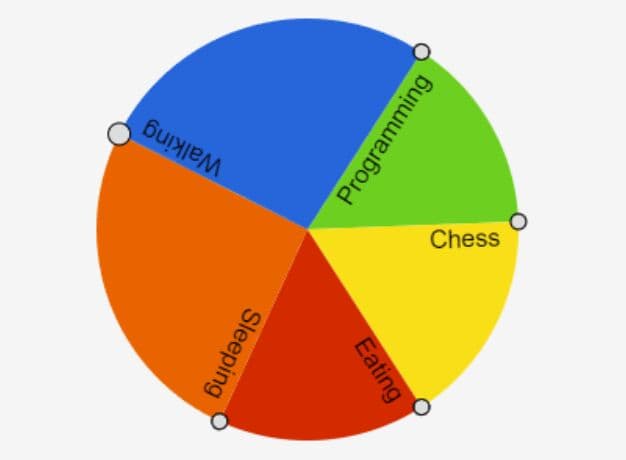
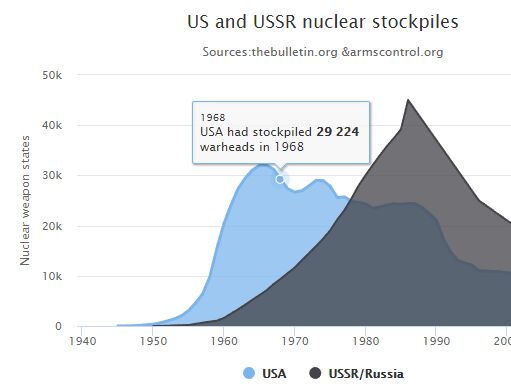
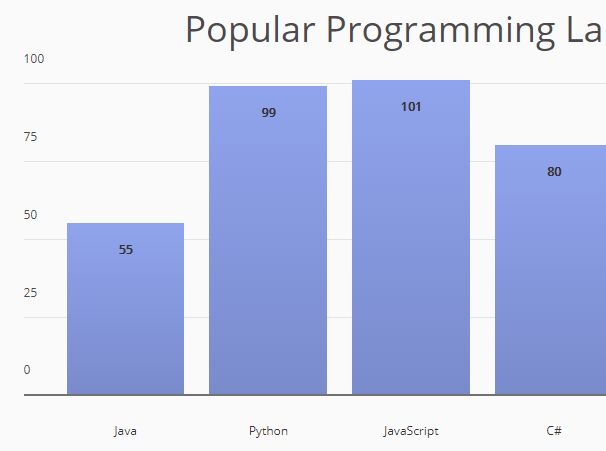
Graph.js is an interactivity and customizable jQuery plugin that makes use of HTML5 SVG to create animated linear, area, bar, combo, pie, and donut charts/graphs with support for multiple datasets.
Basic Usage:
1. Create an empty container to place your SVG graph.
<div id="graph"></div>
2. Include the latest version of jQuery library and jQuery graph.js in the footer.
<script src="https://ajax.googleapis.com/ajax/libs/jquery/1.11.0/jquery.min.js"></script>
<script src="graph.js"></script>
3. Create the data in the javascript and initialize the graph.
<script>
$(function(){
$('#graph').graphify({
start: 'combo', // //type of graph to start with
obj: {
id: 'ggg',
width: 775,
height: 375,
xGrid: false, // False will remove vertical grid lines
legend: true, // Show a legend?
title: 'Linux vs Mac',
points: [
[7, 26, 33, 74, 12, 49, 33],
[32, 46, 75, 38, 62, 20, 52]
],
pointRadius: 3,
colors: ['blue', 'red'],
xDist: 90, // Horizontal distance between vertical grid lines (Makes graph wider)
dataNames: ['Linux', 'Mac'],
xName: 'Day', // Name of X-Axis
tooltipWidth: 15,
animations: true,
pointAnimation: true,
averagePointRadius: 10,
design: {
tooltipColor: '#fff',
gridColor: 'grey',
tooltipBoxColor: 'green',
averageLineColor: 'green',
pointColor: 'green',
lineStrokeColor: 'grey',
}
}
});
});
</script>
4. More options with default values.
xDist: 60,
yDist: 30,
scale: 10,
//leave space for labels:
xOffset: 25,
yOffset: 20,
yStart: 0, // what number do we want to start from for y labels
mainOffset: 35, //to seperate everything from the ylabels
padding: 10, //keep labels from touching edges
//single points
xOfPoints: [], //get x and y coordinates of points
yOfPoints: [],
//multiple points
mxOfPoints: [],
myOfPoints: [],
multipleDataSets: false,
legend: false,
interactive: true,
animations: false,
animationDuration: 1,
pointAnimation: true,
lineAnimation: true,
barAnimation: true,
pieAnimation: true,
grid: true,
xGrid: true,
yGrid: true,
xName: null,
yName: null,
special: null,
showPoints: true,
noLines: false,
pointRadius: 5,
averagePointRadius: 5,
pieSize: 200,
tooltipWidth: 50,
pieLegend: true,
rx: 10, //tooltip roundedness
//add some html before append
before: '',
//after append:
after: '',
title: '', //title of graph to be written in SVG
Change log:
2015-01-13
- Made pie and donut graph tooltips centered in a mathematically accurate way; will now center perfectly regardless of pie size. Also added the example to this repository.
This awesome jQuery plugin is developed by uriahsanders. For more Advanced Usages, please check the demo page or visit the official website.