Animated Feature-rich Chart / Graphic Plugin With jQuery - charts
| File Size: | 48.5 KB |
|---|---|
| Views Total: | 5714 |
| Last Update: | |
| Publish Date: | |
| Official Website: | Go to website |
| License: | MIT |
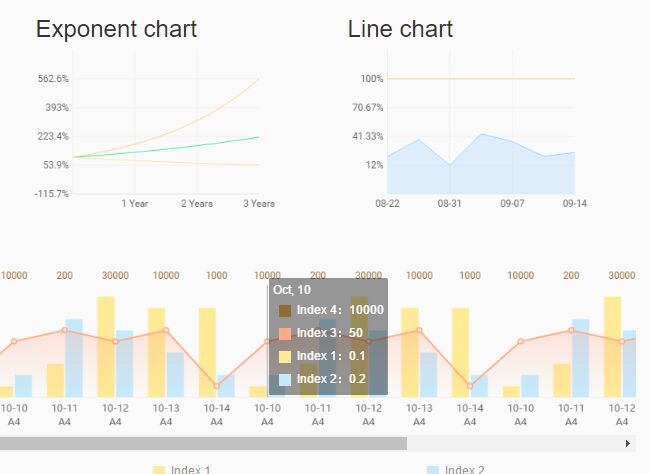
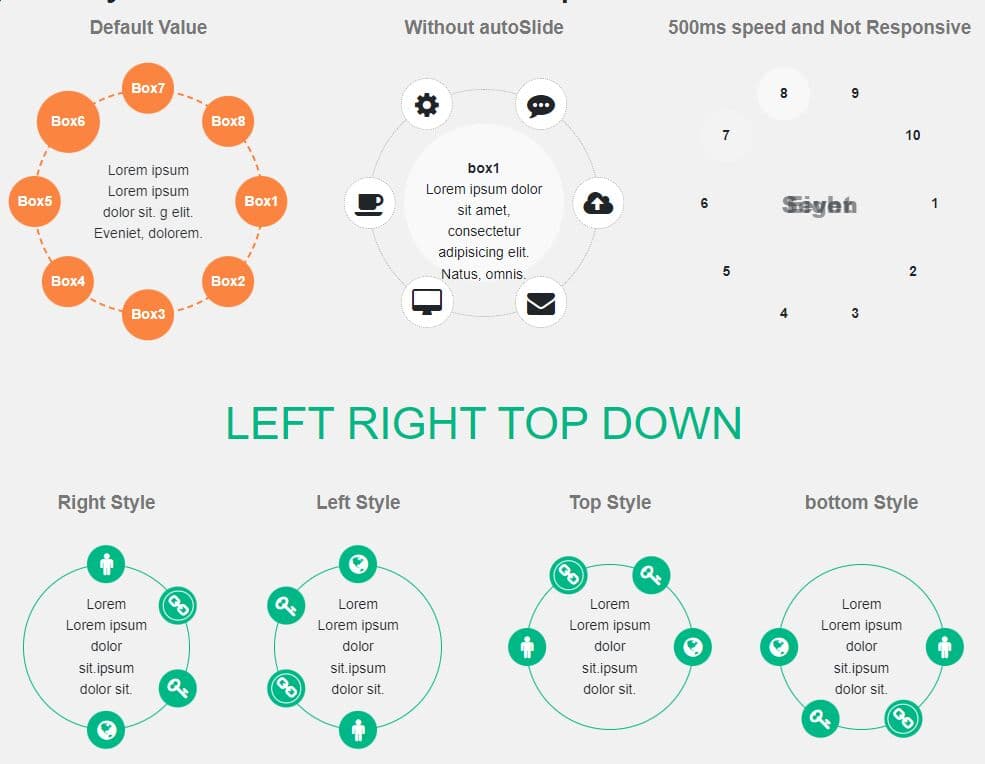
A robust jQuery/HTML5 chart / graph plugin which helps you draw a wide variety of animated, customizable graphics and charts using HTML5 canvas API.
Chart types included:
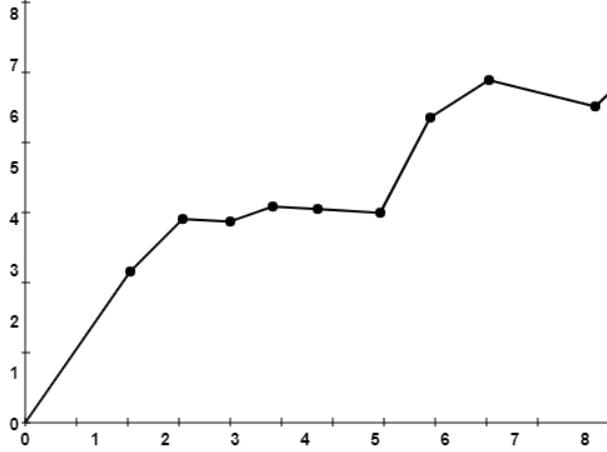
- Pie chart
- Bar chart
- Radar chart
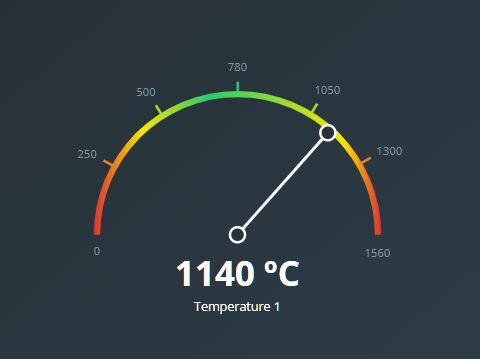
- Score Meter
- Scales chart
- Exponent chart
- Scatter Chart
- Scales chart
How to use it:
1. Load the jQuery charts plugin and other required resources in the html document.
<script src="//code.jquery.com/jquery-3.1.1.min.js"></script>
<script src="dist/utils.js"></script>
<script src="dist/jquery.charts.js"></script>
2. Create an HTML5 canvas element on which you want to draw the charts & graphics.
<canvas id="demo"></canvas>
3. Create custom shapes:
drawCircle(context, x, y, r, s, e, style, type, width):
drawSector(context, x, y, r, s, e, style, type, width):
drawArc(context, x, y, r, s, e, style, width):
drawLine(context, points, style, width)
drawPolygon(context, points, style, type, width)
drawText(context, text, x, y, color, fontSize, fontFamily, align, vertical)
drawRoundRect(context, x, y, w, h, r, style, type, width)
4. Create a line chart on the canvas element.
var canvas_line = $('#demo');

canvas_line.css({
  width: 300,
  height: 200
}).Line({
  data: [[0.21,0.38,0.12,0.44,0.36,0.21,0.25],[1,1,1,1,1,1,1]],
  colors: ["#99d1fd", "#fed27c"],
  isArea: [true,false],
  background: 'transparent',
  frames: 60,
  isAnimation: true,
  animationTime: 5,
  lineWidth: 1,
  isDebug: false,
  events: {
      start: function (options) {
      },
      drawing: function (cValue, tValue, options) {
      },
      end: function (options) {
      }
  },
  axis: {
      x:["08-22","08-31","09-07","09-14"],
      y:4,
      fontSize: 10,
      fontFamily: 'Roboto',
      color: '#666666',
      lineColor:'#EEEEEE',
      lineWidth:1,
      precision: 2,
      isPercent: true,
      manualY: false,
      minY: 0,
      maxY: 0
  }
}).draw();
5. Create a line + bar chart on the canvas element.
var canvas_mix = $('#canvas_mix');

canvas_mix.css({
  width: 1900,
  height: 200
}).LineMixBar({
  data: {
      line: [[
          50, 60, 50, 60, 10,
          50, 60, 50, 60, 10,
          50, 60, 50, 60, 10,
          50, 60, 50, 60, 10,
          50, 60, 50, 60, 10,
          50, 60, 50, 60, 10
      ]],
      bar: [
          [0.1, 0.2], [0.3, 1], [0.9, 0.6], [0.8, 0.4], [0.8, 0.2],
          [0.1, 0.2], [0.3, 0.7], [0.9, 0.6], [0.8, 0.4], [0.8, 0.2],
          [0.1, 0.2], [0.3, 0.7], [0.9, 0.6], [0.8, 0.4], [0.8, 0.2],
          [0.1, 0.2], [0.3, 0.7], [0.9, 0.6], [0.8, 0.4], [0.8, 0.2],
          [0.1, 0.2], [0.3, 0.7], [0.9, 0.6], [0.8, 0.4], [0.8, 0.2],
          [0.1, 0.2], [0.3, 0.7], [0.9, 0.6], [0.8, 0.4], [0.8, 0.2]
      ],
      floatTitle: [
          'Oct, 10', 'Oct, 11', 'Oct, 12', 'Oct, 13', 'Oct, 14',
          'Oct, 10', 'Oct, 11', 'Oct, 12', 'Oct, 13', 'Oct, 14',
          'Oct, 10', 'Oct, 11', 'Oct, 12', 'Oct, 13', 'Oct, 14',
          'Oct, 10', 'Oct, 11', 'Oct, 12', 'Oct, 13', 'Oct, 14',
          'Oct, 10', 'Oct, 11', 'Oct, 12', 'Oct, 13', 'Oct, 14',
          'Oct, 10', 'Oct, 11', 'Oct, 12', 'Oct, 13', 'Oct, 14'
      ],
      top: [[
          '10000', '200', '30000', '10000', '1000',
          '10000', '200', '30000', '10000', '1000',
          '10000', '200', '30000', '10000', '1000',
          '10000', '200', '30000', '10000', '1000',
          '10000', '200', '30000', '10000', '1000',
          '10000', '200', '30000', '10000', '1000'
      ]]
  },
  legends: {
      bar: ['Index 1', 'Index 2'],
      line: ['Index 3'],
      top: ['Index 4']
  },
  units: {
      bar: [],
      line: [' '],
      top: []
  },
  colors: {
      line: ['#FFAA88'],
      bar: ['#FFEA98', '#C5EAFF', '#98D0FF'],
      top: ['#946A33']
  },
  background: 'transparent',
  isDebug: false,
  axis: {
      x: [
          ['10-10', 'A4'], ['10-11', 'A4'], ['10-12', 'A4'], ['10-13', 'A4'], ['10-14', 'A4'],
          ['10-10', 'A4'], ['10-11', 'A4'], ['10-12', 'A4'], ['10-13', 'A4'], ['10-14', 'A4'],
          ['10-10', 'A4'], ['10-11', 'A4'], ['10-12', 'A4'], ['10-13', 'A4'], ['10-14', 'A4'],
          ['10-10', 'A4'], ['10-11', 'A4'], ['10-12', 'A4'], ['10-13', 'A4'], ['10-14', 'A4'],
          ['10-10', 'A4'], ['10-11', 'A4'], ['10-12', 'A4'], ['10-13', 'A4'], ['10-14', 'A4'],
          ['10-10', 'A4'], ['10-11', 'A4'], ['10-12', 'A4'], ['10-13', 'A4'], ['10-14', 'A4']
      ],
      fontSize: 12,
      fontFamily: 'Microsoft YaHei',
      color: '#666666',
      lineColor: '#EEEEEE',
      lineWidth: 1,
      textMarginTopX: 5,
      activeLine: {
          width: 1,
          color: '#999999'
      }
  },
  bar: {
      gap: 2,
      max: 1,
      min: 0,
      default:'',
      defaultColor:'#CCCCCC',
      width: undefined,
      type: 0      // 0 or 1
  },
  line: {
      width: 2,
      dashedLength: 5,
      areaType: 1,          // 0 / 1 / 2
      max: 100,
      min: 0,
      default:'',
      point: {
          radius: 3,
          width: 1,
          fill: 'white'
      }
  },
  top: {
      fontSize: 12,
      fontFamily: 'Roboto',
      color: '#666666',
      textMarginBottom: 5
  }
}).draw();
6. Create a score meter on the canvas element.
var canvas_meter = $('#demo');

canvas_meter.css({
    width: 250,
    height: 250
}).Meter({
    target: 80,
    min: 0,
    max: 100,
    background: 'transparent',
    frames: 60,
    startAngle: 0.8,
    endAngle: 2.2,
    isAnimation: true,
    animationTime: 3,
    isDebug: false,
    events: {
        start: function (options) {
        },
        drawing: function (cValue, tValue, options) {
        },
        end: function (options) {
        }
    },
    colors: ['#ff6131', '#ffad1f', '#4ebf42', '#317fff'],
    title: {
        text: 'Score',
        fontSize: 18,
        fontFamily: 'Roboto',
        color: '#333333'
    },
    subTitle: {
        text: 'Custom Text',
        fontSize: 14,
        fontFamily: 'Roboto',
        color: '#333333'
    },
    arc: {
        type: 0,  // 0 or 1
        defaultColor: 'rgba(51, 51, 51,0.2)',
        targetColor: '#FFFFFF',
        width: 1,
        pointRadius: 6
    },
    tick: {
        type: 0,   // 0 or 1
        length: 10,
        width: 1,
        defaultColor0: '#3c3c3c',
        defaultColor1: '#3c3c3c',
        targetColor: '#3c3c3c'
    },
    tickText: {
        fontSize: 10,
        color: '#3c3c3c',
        fontFamily: 'Roboto'
    },
    scoreText: {
        fontSize: 50,
        fontFamily: 'Roboto',
        type: 0,   // 0 or 1
        color: '#333333',
        precision: 2
    }
}).draw();
7. Create a pie chart on the canvas element.
var canvas_pie = $('#canvas_pie');

canvas_pie.css({
    width: 300,
    height: 300
}).Pie({
    data: [30, 30, 40],
    colors: ['#ff6131', '#ffad1f', '#4ebf42'],
    spacing: 30,
    background: 'transparent',
    frames: 60,
    startAngle: 1,
    isAnimation: true,
    animationTime: 3,
    events: {
        start: function (options) {
        },
        drawing: function (cValue, tValue, options) {
        },
        end: function (options) {
        }
    },
    proportion: {
        isShow: true,
        fontSize: 10,
        fontFamily: 'Roboto',
        textColor: '#333333',
        lineColor: '#333333',
        lineWidth: 1,
        lineLength: 20
    },
    title: {
        text: 'Title 1',
        fontSize: 20,
        fontFamily: 'Roboto',
        color: '#333333'
    },
    subTitle: {
        text: 'Title 2',
        fontSize: 14,
        fontFamily: 'Roboto',
        color: '#333333'
    }
}).draw();
8. Create an exponent chart on the canvas element.
var canvas_exponent = $('#demo');

canvas_exponent.css({
  width: 300,
  height: 200
}).Exponent({
  target: 3,
  data: [1.8142, 1.311, 0.8079],
  colors: ["#ffd076", "#43e1a7", "#fee0a6"],
  background: 'transparent',
  frames: 60,
  isAnimation: true,
  animationTime: 5,
  lineWidth: 1,
  isDebug: false,
  isPercent: true,
  events: {
      start: function (options) {
      },
      drawing: function (cValue, tValue, options) {
      },
      end: function (options) {
      }
  },
  axis: {
      x: ['', '1 Year', '2 Years', '3 Years'],
      y: 4,
      fontSize: 10,
      fontFamily: 'Roboto',
      color: '#666666',
      lineColor: '#EEEEEE',
      lineWidth: 1,
      manualY: false,
      minY: 0,
      maxY: 10,
      isShowMinY: true
  }
}).draw();
9. Create a Scales Chart on the canvas element.
var canvas_scale = $('#canvas_scale');

canvas_scale.css({
    width: 300,
    height: 120
}).Scale({
    type: 1, // 0 or 1
    min: 0,
    max: 100,
    target: 100,
    background: 'transparent',
    frames: 60,
    isAnimation: true,
    animationTime: 5,
    isDebug: false,
    events: {
        start: function (options) {
        },
        drawing: function (cValue, tValue, options) {
        },
        end: function (options) {
        }
    },
    tick: {
        colorType: 0, // 0 or 1
        valueType: 0, // 0 or 1
        width: 1,
        defaultColor: '#CCCCCC',
        targetColor: '#ffc733',
        tickCount: 100,
        textColor: '#999999',
        fontSize: 12,
        fontFamily: 'Roboto'
    },
    cursor: {
        textColor: 'white',
        fontSize: 10,
        fontFamily: 'Roboto',
        background: 'black',
        triangleColor: 'black',
        textStart: '',
        textEnd: ''
    },
    colors: ['#3bb268', '#48efb2', '#ffee30', '#ffa530', '#ff6131']
}).draw();
10. Create a Scatter Chart on the canvas element.
var canvas_scatter = $('#demo');

canvas_scatter.css({
  width: 300,
  height: 300
}).Scatter({
  alpha: 0.3,
  beta: 1,
  background: 'transparent',
  frames: 60,
  isAnimation: true,
  animationTime: 5,
  lineWidth: 1,
  isDebug: false,
  events: {
      start: function (options) {
      },
      drawing: function (type,cValue, tValue, options) {
      },
      end: function (options) {
      }
  },
  axis: {
      color: '#666666',
      width: 1
  },
  point: {
      color: '#666666',
      radius: 1,
      count: 60,
      rang: 20
  },
  line: {
      base: {
          width: 1,
          color: 'orange'
      },
      alpha: {
          width: 1,
          color: 'red'
      },
      beta: {
          width: 1,
          color: 'green'
      }
  },
  valueText: {
      type: 2,
      fontSize: 12,
      fontFamily: 'Roboto',
      color: '#333333'
  }
}).draw();
Change log:
2016-12-08
- bugfixes
2016-12-01
- improvement.
This awesome jQuery plugin is developed by ShujiaWu. For more Advanced Usages, please check the demo page or visit the official website.