Clean Customizable Graph & Chart Plugin with jQuery and Canvas - Graphly
| File Size: | 69.5 KB |
|---|---|
| Views Total: | 3792 |
| Last Update: | |
| Publish Date: | |
| Official Website: | Go to website |
| License: | MIT |
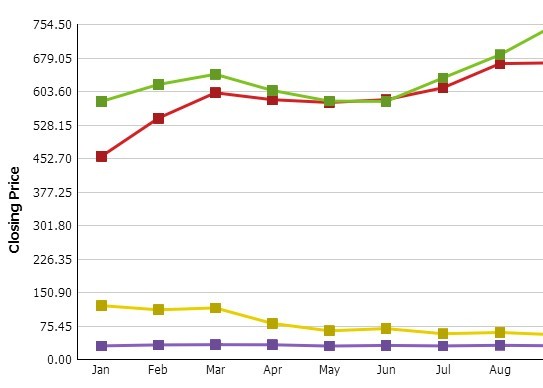
Graphly is a lightweight jQuery plugin to render an Canvas based graph & chart from your data constructed in a Javascript file. The plugin is designed to be highly customizable and supports various types of charts such as bar chart, line chart, and much more.
Basic usage:
1. Include the latest jQuery library together with jquery.graphly.min.js into your document.
<script src="http://ajax.googleapis.com/ajax/libs/jquery/1.11.0/jquery.min.js"></script>
<script src="js/jquery.graphly.min.js"></script>
2. Create an canvas element where you want to render a chart.
<canvas id="demo"></canvas>
3. Create the data for a basic bar chart following the data structure as follows.
$(function() {
var basic_graph_data = {
xLabel: 'Month',
yLabel: 'Closing Price',
groups: [
{
label: 'Months',
values: [
{
label: 'Jan',
value: 120.20
},
{
label: 'Feb',
value: 110.73
},
{
label: 'Mar',
value: 115.04
},
{
label: 'Apr',
value: 80.14
},
{
label: 'May',
value: 63.44
},
{
label: 'Jun',
value: 68.49
},
{
label: 'Jul',
value: 56.85
},
{
label: 'Aug',
value: 59.72
},
{
label: 'Sep',
value: 54.44
},
{
label: 'Oct',
value: 79.24
},
{
label: 'Nov',
value: 81.71
},
{
label: 'Dec',
value: 92.59
}
]
}
]
};

});
4. Call the plugin on the canvas element.
$('#demo').graphly({ 'data' : basic_graph_data });
5. Default settings.
'data'          : null,
'type'          : 'bar',
'paddingTop'    : 1,
'paddingLeft'   : 1,
'paddingBottom' : 1,
'paddingRight'  : 1,
'showLabels'    : true,
'showLegend'    : true,
'width'         : null,
'height'        : null,
'theme'         : 'default',
'removeBorders' : false,
'customTheme'   : null
This awesome jQuery plugin is developed by rastating. For more Advanced Usages, please check the demo page or visit the official website.


