jQuery Interactive Vector Map Plugin - Mapael
| File Size: | 715 KB |
|---|---|
| Views Total: | 17924 |
| Last Update: | |
| Publish Date: | |
| Official Website: | Go to website |
| License: | MIT |

Mapael is a plugin based on jQuery and Raphaël that allows you to create Interactive and SEO-friendly vector maps for your project.
Download Vector maps for jQuery Mapael.
Features:
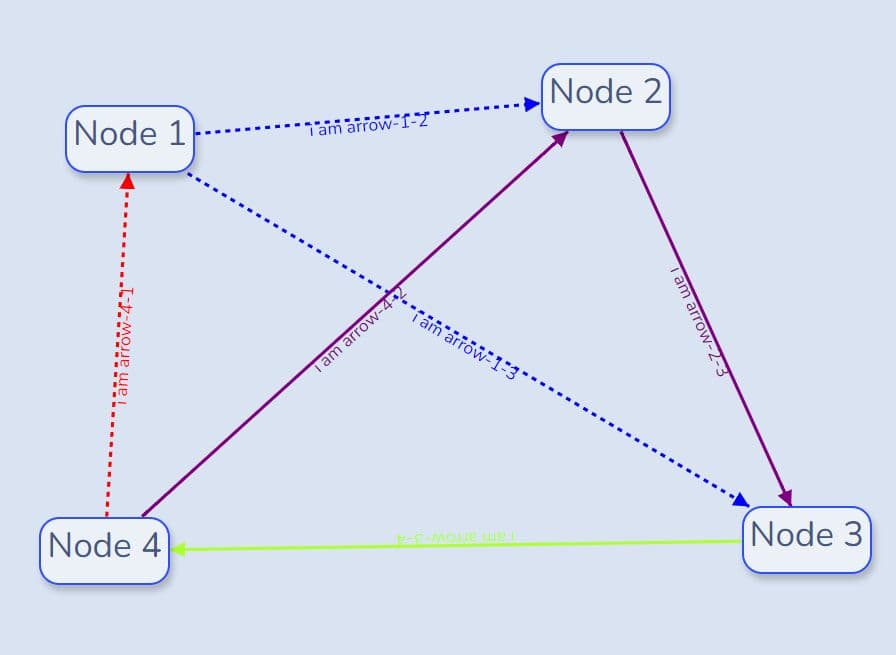
- Interactive. Set a link, a tooltip and some events on the areas of the map
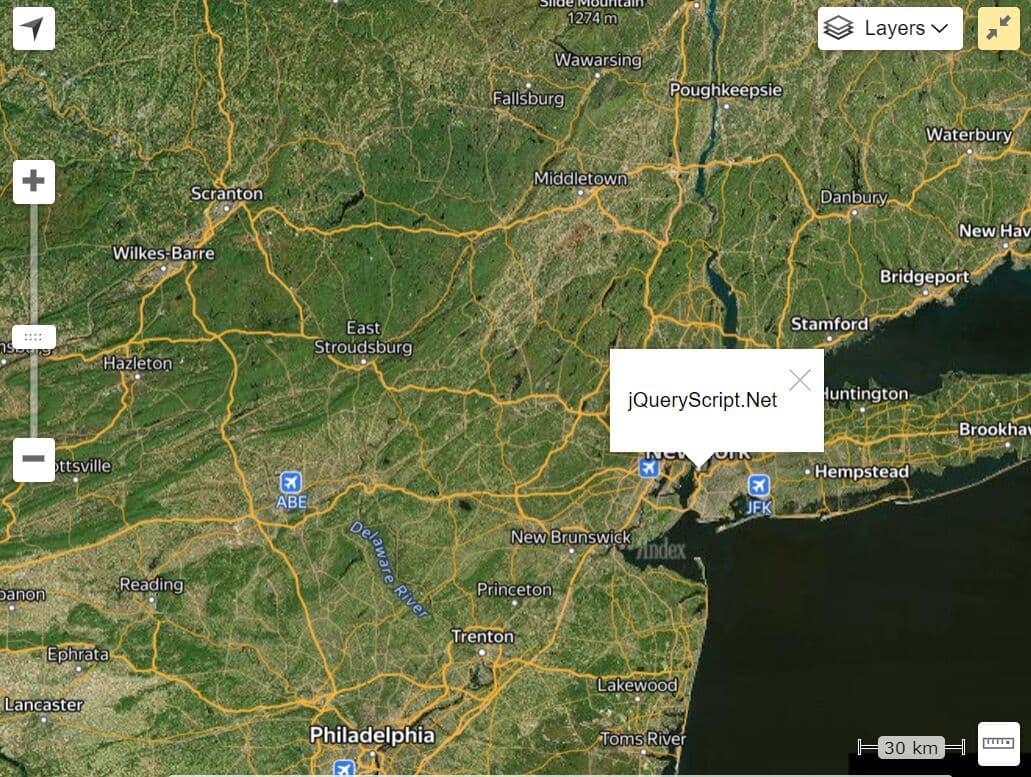
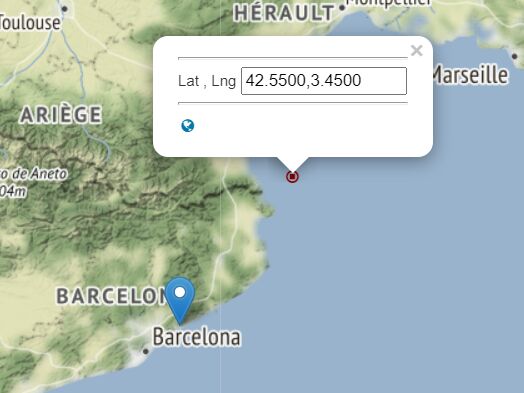
- Plottable cities with their latitude and their longitude
- Areas and plots colorization. Mapael automatically sets a color to each area of your map and generates the legend in order to build pretty dataviz
- Easy to add new maps. Build your own maps based on SVG format
- Resizable Thanks to raphael.js, maps are easily resizable.
Installation:
# NPM
$ npm install jquery-mapael
Basic usage:
1. Include jQuery library, Raphaël on the web page
<script src="http://code.jquery.com/jquery-1.9.1.min.js" charset="utf-8" ></script>
<script src="js/raphael/raphael-min.js"></script>
2. Include jQuery Mapael plugin and a USA Map on the page.
<script src="js/jquery.mapael.js" charset="utf-8" ></script>
<script src="js/maps/usa_states.js" charset="utf-8" ></script>
3. Create a container for your vector map.
<div class="example"> </div>
4. The javascript
$(function(){

$(".example").mapael({
map : {
name : "usa_states"
, width : 250
}
});
});
5. All the default map settings.
map: {
    cssClass: "map",
    tooltip: {
        cssClass: "mapTooltip",
        target: null
    },
    defaultArea: {
        attrs: {
            fill: "#343434",
            stroke: "#5d5d5d",
            "stroke-width": 1,
            "stroke-linejoin": "round"
        },
        attrsHover: {
            fill: "#f38a03",
            animDuration: 300
        },
        text: {
            position: "inner",
            margin: 10,
            attrs: {
                "font-size": 15,
                fill: "#c7c7c7"
            },
            attrsHover: {
                fill: "#eaeaea",
                "animDuration": 300
            }
        },
        target: "_self"
    },
    defaultPlot: {
        type: "circle",
        size: 15,
        attrs: {
            fill: "#0088db",
            stroke: "#fff",
            "stroke-width": 0,
            "stroke-linejoin": "round"
        },
        attrsHover: {
            "stroke-width": 3,
            animDuration: 300
        },
        text: {
            position: "right",
            margin: 10,
            attrs: {
                "font-size": 15,
                fill: "#c7c7c7"
            },
            attrsHover: {
                fill: "#eaeaea",
                animDuration: 300
            }
        },
        target: "_self"
    },
    defaultLink: {
        factor: 0.5,
        attrs: {
            stroke: "#0088db",
            "stroke-width": 2
        },
        attrsHover: {
            animDuration: 300
        },
        text: {
            position: "inner",
            margin: 10,
            attrs: {
                "font-size": 15,
                fill: "#c7c7c7"
            },
            attrsHover: {
                fill: "#eaeaea",
                animDuration: 300
            }
        },
        target: "_self"
    },
    zoom: {
        enabled: false,
        maxLevel: 10,
        step: 0.25,
        zoomInCssClass: "zoomIn",
        zoomOutCssClass: "zoomOut",
        mousewheel: true,
        touch: true,
        animDuration: 200,
        animEasing: "linear",
        animCallack: null
    }
},
legend: {
    area: [],
    plot: []
},
areas: {},
plots: {},
links: {}
6. Default Legend options.
area: {
  cssClass: "areaLegend",
  display: true,
  marginLeft: 10,
  marginLeftTitle: 5,
  marginBottomTitle: 10,
  marginLeftLabel: 10,
  marginBottom: 10,
  titleAttrs: {
      "font-size": 16,
      fill: "#343434",
      "text-anchor": "start"
  },
  labelAttrs: {
      "font-size": 12,
      fill: "#343434",
      "text-anchor": "start"
  },
  labelAttrsHover: {
      fill: "#787878",
      animDuration: 300
  },
  hideElemsOnClick: {
      enabled: true,
      opacity: 0.2
  },
  slices: [],
  mode: "vertical"
}, plot: {
  cssClass: "plotLegend",
  display: true,
  marginLeft: 10,
  marginLeftTitle: 5,
  marginBottomTitle: 10,
  marginLeftLabel: 10,
  marginBottom: 10,
  titleAttrs: {
      "font-size": 16,
      fill: "#343434",
      "text-anchor": "start"
  },
  labelAttrs: {
      "font-size": 12,
      fill: "#343434",
      "text-anchor": "start"
  },
  labelAttrsHover: {
      fill: "#787878",
      animDuration: 300
  },
  hideElemsOnClick: {
      enabled: true,
      opacity: 0.2
  },
  slices: [],
  mode: "vertical"
}
Change Logs:
v2.2.0 (2018-03-09)
- Feature : Added the ability to zoom on a specific plot or a specific area through the zoom event
- Feature : The cssClass option can now be updated when trigerring an 'update' event
- Feature : Added links to the parameter of the afterUpdate hook
- Performance : Optimised overall Zoom performances
- Performance: use event delegation
- Improvement : Provide a better version of the map of the World
- Improvement : Better dependencies / installation instructions
- Improvement : Mapael version is now accessible through $.mapael.version
- Bugfix : Fixed behaviour of the 'clicked' legend option with plots
- Bugfix : Fixed the update event when plotsOn option used
v2.1.0 (2017-11-15)
- Feature : Allow to add custom CSS class to areas, plotted points and links
- Bugfix : Fix load for CommonJS
- Bugfix : Restaure 'mousewheel' event propagation
- Bugfix : Fix elements hidding through clicks on legend items when some values are straddling two different slices in hideMapElems() function
- Bugfix : Prevent to move the clicked element instead of dragging the map (behaviour seen with Firefox)
- Bugfix : Fix destroy() in order to empty map and legends containers instead of the main container
- Feature : Add toFront option available on area/plot/link options when triggering
- Feature : Add redrawOnResize option
- Improve updateElem() performance
- Bugfix : Fix namespaces for events bindings
- Feature : Added plotsOn option to add points on areas' centers
- Bugfix : Fix Western Sahara's code in world map
- Fix: custom event handler on text element
- Various internal improvements
- Fix responsive event regression
- Perform createLegend at the same time as areas
2016-06-11
- v2.0.0
2015-11-04
- Replace FOR loop by jQuery.Each()
2015-11-03
- Removed 'legends' variable
- Updated examples
2015-11-02
- Allow legend options to be updated
2015-11-01
- Fix 'update' event : Add new links to options.links object
2015-10-31
- Fixed : newLinks collection add to current links collection
2015-10-28
- Added animDuration option to 'zoom' event and set it to 0 by default for initial zoom
- Added AMD and CommonJS compatibility
2015-10-23
- Avoid IE8 js error on map update
2015-10-22
- Allow to set the animDuration for legend click
2015-09-25
- Fixed zoomX and zoomY values
2015-09-01
- v1.1.0
- Fixed horizonal legend display for areas
2015-08-31
- Fixed links update
2015-08-28
- Added events zoomEnd and panningEnd
2015-08-25
- Added support for animated zoom
- Fixed horizontal legend with squares
- added SVG plots feature
- Fixed tooltip position
- Allow users to overload cssClass of tooltips
- Added option to enable or disable touch zoom
2015-07-13
- Added 'exclusive' option on legend, and 'hidden' option on legend items
2015-05-26
- Fix tooltip position in absolutely positioned elements
2015-05-18
- v1.0.1
2015-01-04
- Fix spaces
2015-01-03
- Version 1.0.0
2014-12-01
- Allow to add links between couples of lat,long or x,y coordinates
2014-11-30
- Fixed tooltip position on mouseover added
2014-11-14
- Fixed quotes.
2014-10-26
- Fixed quotes.
- Allow to set a fixed value instead of a couple of min and max values for the legend slices.
2014-10-22
- Fixed legend scale
v0.7.1 (2014-01-24)
- version update.
v0.7.0 (2013-12-04)
- Added new example with the zoom features
- Don't animate areas and plots in the legend on mouse hover
v0.6.0 (2013-09-29)
- updated to the latest version
This awesome jQuery plugin is developed by neveldo. For more Advanced Usages, please check the demo page or visit the official website.