10 Best Gantt Chart Plugins In JavaScript (2026 Update)
What Is A Gantt Chart?
A Gantt Chart renders project timelines, task dependencies, and resource allocation in a horizontal bar format. You can use it to build project management dashboards, scheduling interfaces, and workflow visualization panels.
The 10 Best Gantt Chart Libraries
This article ranks 10 JavaScript gantt chart libraries based on three metrics: GitHub stars (community adoption), update frequency (active maintenance), and page views on jQueryScript.net/CSSScript.com over the past year (real-world usage).
The list below includes both jQuery plugins and vanilla JavaScript libraries for creating Gantt Charts. jQuery options provide faster integration with legacy web projects. Vanilla JS libraries deliver better performance and modern framework compatibility.
Each library listed here solves different project requirements. Some prioritize visual editing with drag-and-drop interactions. Others focus on data visualization with minimal configuration. Review the feature lists and use cases to find the library that matches your technical constraints and timeline complexity.
Originally Published Nov 16 2020, updated Dec 20 2025
Table of contents:
Best jQuery Gantt Chart Plugins
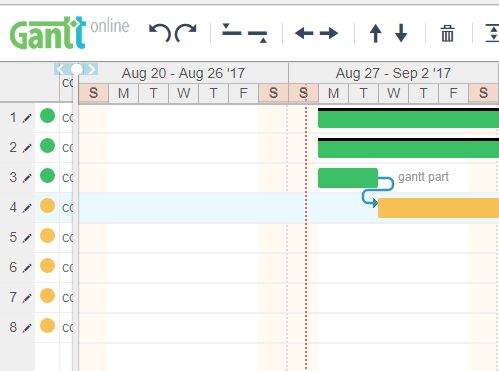
Fully Featured Gantt Chart Component By IBM
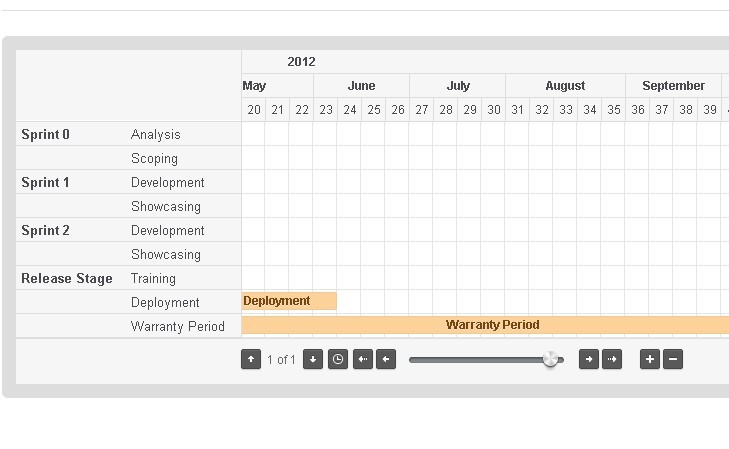
A JavaScript library that provides an easy way to implement a customizable, professional, full featured online gantt chart generator for scheduling your tasks on your modern web app.
Features:
- Works with jQuery, Vanilla JavaScript, and React.js framework.
- Collapsible task names.
- Fully responsive and auto fits your layout.
- Custom date format.
- Custom time table rendering and layout.
- Allows the user to zoom in/out the Gantt Chart.
- Allows the user to filter and search through data.
- Supports AJAX data fetching.
- Supports any types of data: "json", "xml", "html" or "text".
Best For:
- Enterprise project management
Powerful Gantt Chart Editor With jQuery - jQueryGantt
A powerful, customizable jQuery Gantt editor that helps you dynamically create a gantt chart for your flexible project management.
Features:
- Cross browser.
- Keyboard interactions.
- SVG based visual editor.
- Import/Export JSON.
- Drag and drop.
- Mobile/Print friendly.
Best For:
- Interactive project editors
- Applications requiring offline print support
Simple Dynamic Gantt Chart Plugin With jQuery - Gantt Chart
Gantt Chart is a Simple jQuery Chart Plugin that implements gantt functionality as a jQuery component.
Features:
- Read json data
- Paging results
- Display different colours for each task
- Display short description as hints
- Mark holidays
Best For:
- Simple task tracking
- Lightweight jQuery projects
Canvas-based Gantt Chart Plugin - jQuery simpleGantt.js
A lightweight and open-source jQuery plugin that helps developers generate simple, customizable, and HTML5 canvas based Gantt Charts on the page. It relies on day.js or moment.js for date parsing.
The plugin provide a clear visual representation of the project timeline and can help you identify potential problems and make adjustments to the project schedule as needed. The bars on the Gantt chart represent the duration of each task, and they can be used to show the start and end dates of each task.
Best For:
- Performance-focused displays
- Basic timeline visualization

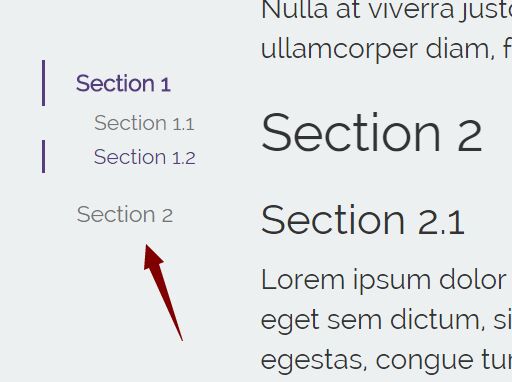
Stacked Horizontal Gantt Chart Plugin With jQuery
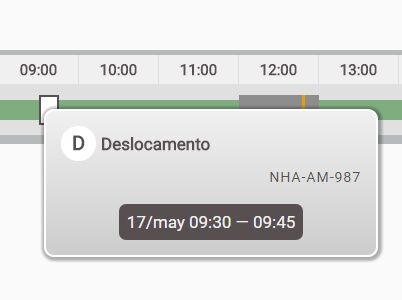
A simple, configurable jQuery plugin for creating a timeline-style gantt chart to illustrates a project schedule with custom markers and stacked activities.
Best For:
- Visualizing overlapping tasks
- Simple schedule illustrations
Best Vanilla JS Gantt Chart Libraries
Frappe Gantt
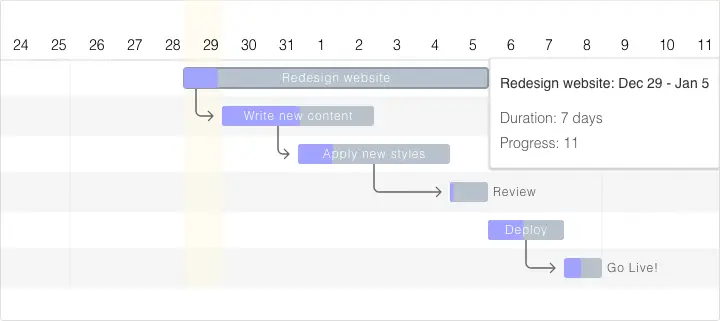
A draggable, resizable, multilingual, modern-looking Gantt Chart library written in JavaScript and SVG.
Features:
- Customizable Views: customize the timeline based on various time periods - day, hour, or year, you have it. You can also create your own views.
- Ignore Periods: exclude weekends and other holidays from your tasks' progress calculation.
- Configure Anything: spacing, edit access, labels, you can control it all. Change both the style and functionality to meet your needs.
- Multi-lingual Support: suitable for companies with an international base.
Best For:
- Modern web applications
- International project teams
Generate Interactive SVG/Canvas Gantt Charts With JavaScript
An easy-to-use yet robust JavaScript library for generating interactive Gantt charts using SVG, Canvas and JSX. Can be used to represent project schedules, dependencies, and progress in a graphical manner.
Best For:
- Complex dependency management
- Projects requiring flexible rendering options

Easy Gantt Chart Builder In JavaScript – Gantt.js
A tiny JavaScript library that makes it easier to render a simple, plain, responsive Gantt Chart from any scheduled tasks defined in a JS array.
Best For:
- Quick implementations
- Small datasets

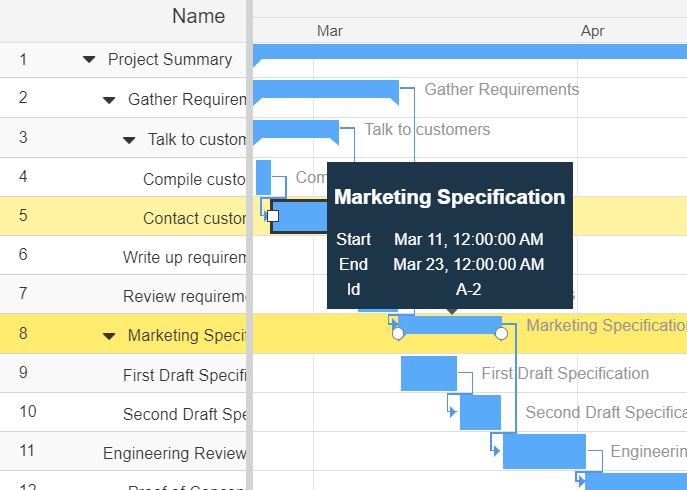
Versatile Gantt Chart Component – jsGantt
A customizable, flexible, multilingual Gantt Chart component built with vanilla JavaScript. It uses client-side rendering for fast performance and dynamic interactivity. Perfect for any project requiring an interactive timeline or schedule display.
Features:
- Multilingual Support: Make your Gantt charts globally accessible with support for multiple languages.
- Tasks and Collapsible Task Groups: Structure your tasks in an organized manner and easily navigate through them.
- Dependencies and Highlighting: Visualize task dependencies and get task details with a simple hover.
- Data Editability: Update your Gantt table on-the-go with an embedded list of responsible parties.
- Additional Columns: Enrich your Gantt table with more data using additional columns.
- Dynamic Loading and Format Change: Load tasks dynamically and switch effortlessly between Hour, Day, Week, Month, and Quarter formats.
- Remote or Local Data: Source your Gantt data from local JS objects or remote JSON/XML data sources.
- Also works with Angular, React, Vue, and .Net
Best For:
- Large datasets
- Multi-framework environments

Interactive Gantt Charts in Vanilla JavaScript – VikCraft Gantt
A lightweight Vanilla JavaScript library that creates interactive and highly configurable Gantt charts for project management applications.
It transforms your project data into dynamic, visual timelines where users can drag tasks, adjust durations, manage dependencies, and edit project details directly within the chart interface.
Best For:
- Interactive project dashboards
- Vanilla JavaScript applications

Choosing the Right Gantt Chart Library
Projects requiring visual editing should examine jQueryGantt or VikCraft Gantt for drag-and-drop capabilities. Applications tracking task dependencies benefit from jsGantt's relationship visualization or the SVG/Canvas library's dependency lines.
Teams working across time zones need Frappe Gantt's multi-language support and flexible timeline views. Simple timeline displays work well with Gantt.js or the basic jQuery Gantt Chart plugin.
IBM's Gannt Chart component suits enterprise applications requiring multi-framework compatibility and advanced filtering. Canvas-based rendering from simpleGantt.js delivers optimal performance for large datasets.
Consider your data structure, editing requirements, and performance constraints when selecting a library.
More Resources:
Seeking more jQuery plugins or JavaScript libraries to create analog clocks on the page? See jQuery Gantt Chart and JavaScript Gantt Chart sections for details.
See Also:
- 10 Best Timeline Components In jQuery And Pure JS/CSS
- 10 Best Pie/Donut Chart Plugins In JavaScript
- 10 Best Flowchart JavaScript Libraries To Visualize Your Workflow
- 7 Best Organizational Chart Generators In JavaScript Or Pure CSS