10 Best Pie/Donut Chart Plugins In JavaScript (2026 Update)
Are you looking for the best JavaScript Chart libraries to present your data in a circle with proportional segments showing proportions and percentages between categories? You’ve come to the right place because I’ll be sharing some of the best Pie Chart libraries that are pretty snazzy.
Check out this list of the 10 best JavaScript/jQuery/Pure CSS chart libraries and see what works best for you. These JavaScript libraries can help you display information from a range of values, percentages and more via creating interactive pie, donut and ring charts.
Feel free to download use them in your next project to plotand visualize your data in a pie- or donut-style circular statistical graphic. Have fun!
Originally Published Oct 2019, updated Feb 12 2026
Table of contents:
jQuery Pie/Donut Chart Plugins:
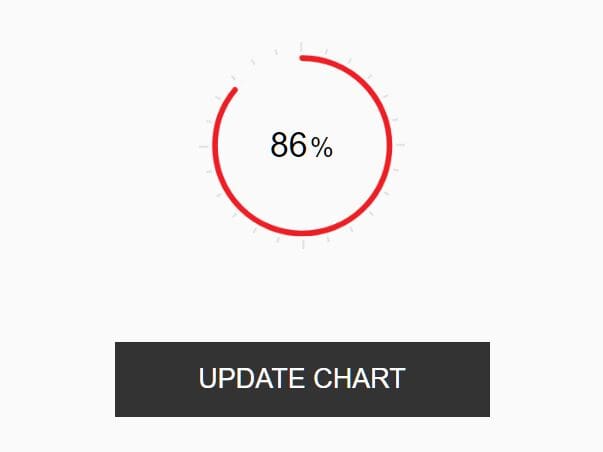
Customizable Pie Chart/Round Progress Bar Plugin - easy-pie-chart
easy-pie-chart is a lightweight JavaScript/jQuery plugin to draw animated, customizable, retina-ready pie/ring charts and circular progress bars using HTML5 Canvas and requestAnimationFrame API.
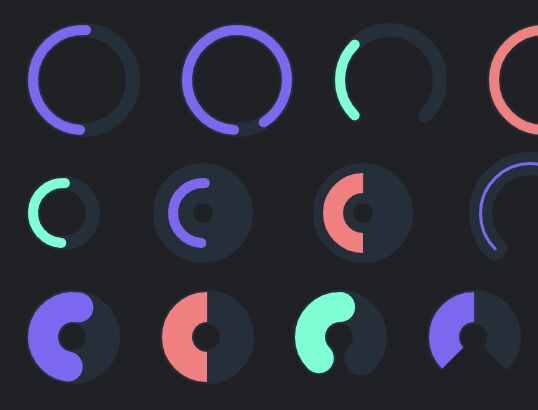
Animated Donut/Pie/Ring Charts With jQuery And SVG - Donutty
Donutty is a JavaScript/jQuery charting library which lets you generate smoothly animated, fully scalable Donut/Pie/Ring Charts or Circular/Radial progressbars using SVG and CSS3 animations.
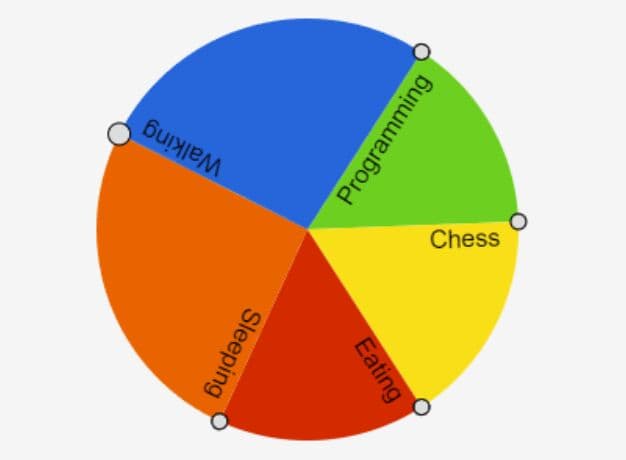
Touch-enable Draggable Pie Chart Generator In JavaScript/jQuery
A JavaScript/jQuery plugin that helps developers generate a draggable, interactive, mobile-friendly pie chart using HTML5 canvas.
Elegant SVG Pie & Donut Chart Plugin - listtopie.js
A jQuery pie chart plugin that makes uses of snap.svg to render an elegant, customizable, animated, nice-looking pie & donut charts for your statistic data.

Animated Ring(Donut) Chart Plugin With jQuery And D3.js
Animated Donut Graph jQuery Plugin with d3js.
Vanilla JavaScript Pie/Donut Chart Plugins:
Animated Pie/Donut/Ring Chart With Canvas And JavaScript – rpie.js
A tiny yet configurable chart library to render Pie/Donut/Ring charts on an HTML5 canvas element.

Minimal SVG Donut/Pie Chart Generator – donut.js
A tiny JavaScript library for generating SVG donut/pie/ring charts to present data in an engaging way, including portfolio allocations, budget breakdowns, sales data, performance metrics, customer demographics, and more.

Minimal Doughnut Chart With JavaScript And SVG – donut-chart.js
A small and easy JavaScript library which utilize SVG to draw dynamic doughnut/ring charts on the web app.

Pure CSS Pie/Donut Chart Plugins:
CSS Only Donut Chart With Custom Slices
A minimal clean donut chart to represent percentage values as slices using pure CSS/SCSS.

Single Element Pie Chart (Circle Diagram) With CSS
A circle chart or pie chart is a circular statistic graph, which represents the proportions of a whole.

Conclusion:
In the past decade, visualizations have become more important than ever before. The pie chart remains popular because it allows you to compare different values without requiring any further interpretation.
It's great for visualizing one data set with associated percentages for each dimension of a two-dimensional graphic.
In this list above we have compiled a list of 10 best Pie, Donut and Ring Chart JavaScript libraries that you can use to make your charts more interactive, beautiful and appealing.
Looking for more jQuery plugins or JavaScript libraries to create awesome Pie/Donut/Ring Charts on the web & mobile? See jQuery Chart & Graph and JavaScript Chart sections for more details.
See Also:
- 7 Best Organizational Chart Generators In JavaScript Or Pure CSS
- 10 Best Bar (Column) Chart Plugins In Javascript & CSS
- 7 Best Gantt Chart Plugins In JavaScript
- 10 Best Flowchart JavaScript Libraries To Visualize Your Workflow
- 10 Best Circular/Radial Progress Bar JavaScript Plugins