Creating A Responsive Scatter Plot Graph Using jQuery Scatterplot Plugin
| File Size: | 44.6KB |
|---|---|
| Views Total: | 2876 |
| Last Update: | |
| Publish Date: | |
| Official Website: | Go to website |
| License: | MIT |
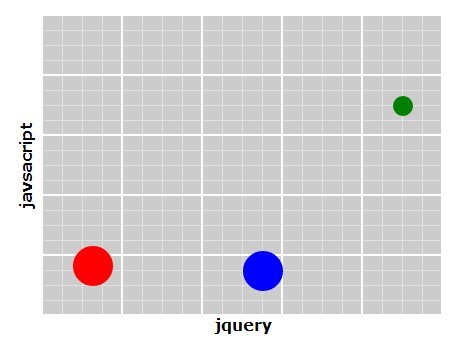
Scatterplot is a lightweight jQuery plugin for creating a customizable and responsive scatter plot (XY) graph & diagram to display values for two variables for a set of data.
Basic Usage:
1. Include required basic stylesheet in your page.
<link href="css/scatterplot.css" rel="stylesheet" type="text/css" />
2. Create the html for a scatter plot.
<div id="demo">
<span id="Point1"></span>
<span id="Point2"></span>
<span id="Point3"></span>
</div>
3. Include the jQuery javascript library and jQuery Scatterplot plugin at the end of your page.
<script src="http://ajax.googleapis.com/ajax/libs/jquery/1.10.2/jquery.min.js"></script>
<script src="js/scatterplot.js" type="text/javascript"></script>
4. The javascript.
$('#demo').scatter({
height: 300,
width: 400,
xLabel: 'jQuery',
yLabel: 'javascript',
rows: 5,
columns: 5,
subsections: 4
});
$('#Point1').plot({
xPos: 50,
yPos: 50,
color: 'red'
});
$('#Point2').plot({
xPos: 220,
yPos: 45,
radius: 20,
color: 'blue'
});
$('#Point3').plot({
xPos: 360,
yPos: 210,
radius: 10,
color: 'green' });
5. Available options.
$('#demo').scatter({
height: 300, // Height of the graph (ex: 500, '50%')
width: 300, // Width of the graph (ex: 500, '50%')
xLabel: '', // Text of label for X-axis
yLabel: '', // Text of label for Y-axis
rows: 1, // Number of rows in graph
columns: 1, // Number of columns in graph
subsections: 1, // Number of subsections for each row/column
color: '#CCC',  // Background color of graph
responsive: false,  // Set whether graph is responsive (position of labels, units, lines, points set to percentages)
xUnits: [], // Array of units for X-axis (will be evenly spaced from bottom-left corner to bottom-right corner) (ex: ["0%", "20%", "40%", "60%", "80%", "100%"], [0, 10, 20, 30, 40, 50])
yUnits: []  // Array of units for Y-axis (will be evenly spaced from bottom-left corner to bottom-right corner) (ex: ["0%", "20%", "40%", "60%", "80%", "100%"], [0, 10, 20, 30, 40, 50])
});
Change log:
v1.1.1 (2013-12-13)
- Added CSS overrides for background-color & width. When creating points, adding the style attribute and setting the 'background-color' property to a color value will set the color of the point. The 'width' property will allow for explicitly setting the width (2 * radius) of the point.
This awesome jQuery plugin is developed by pwoidke. For more Advanced Usages, please check the demo page or visit the official website.