Creating A Simple Square Pie Chart with jQuery Waffly Plugin
| File Size: | 41.7KB |
|---|---|
| Views Total: | 3146 |
| Last Update: | |
| Publish Date: | |
| Official Website: | Go to website |
| License: | MIT |

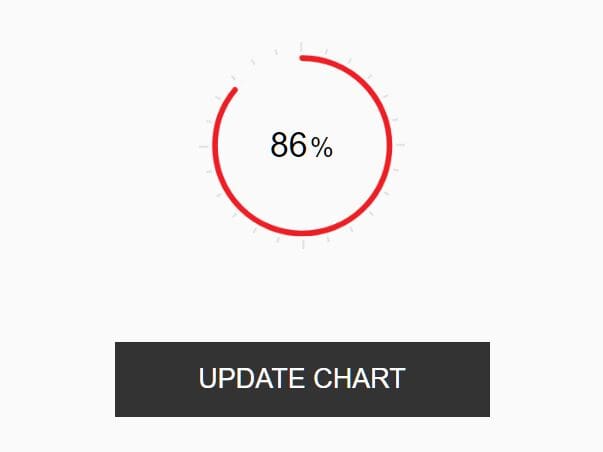
Waffly is a simple yet customizable jQuery chart plugin for rendering a square pie chart (or waffle chart) within a DOM element by using data-* attributes.
How to use it:
1. Create a container for the square pie chart. Using data-waffly-value attribute to specify the percentage value.
<div class="demo" data-waffly-title="Your Chart's Title" data-waffly-value="60%">Tooltip</div>
2. Load the latest version of jQuery library and jQuery waffly plugin at the end of your document.
<script src="http://ajax.googleapis.com/ajax/libs/jquery/1.10.2/jquery.min.js"></script>
<script src="jquery.waffly.js"></script>
3. Call the plugin with all the default options.
<script>
$(document).ready(function() {
$('.demo').waffly({
default_color: '',
graph_font: 'arial, sans-serif',
graph_title_color: '#05c',
graph_value_color: '#05c',
graph_color: '#05c',
graph_value:'80%',
graph_margin: '30px',
graph_class:'sel',
total_dots: 100,
graph_width: 900,
dot_row:10,
dot_gap:2,
dot_radius:'0%',
dot_opacity:'.5',
graph_reverse: false,
graph_animate:true
});
});
</script>
Change log:
2013-01-08
- Freestyle version
2013-01-04
- added reverse and animated mode!
This awesome jQuery plugin is developed by HermanosClever. For more Advanced Usages, please check the demo page or visit the official website.