Clean and Minimal jQuery Chart Plugin - jqCandlestick
| File Size: | 42.3 KB |
|---|---|
| Views Total: | 7184 |
| Last Update: | |
| Publish Date: | |
| Official Website: | Go to website |
| License: | MIT |
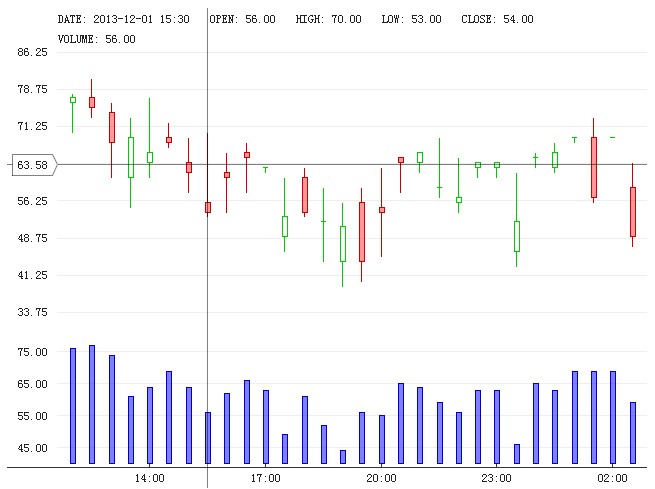
jqCandlestick is a jQuery and canvas based plugin that makes it easier to create point chart, plot chart, line chart, column chart, bar chart, and candlestick chart.
Basic Usage:
1. Include the latest version of jQuery library and jqCandlestick plugin on the web page.
<script src="http://ajax.googleapis.com/ajax/libs/jquery/2.0.3/jquery.min.js"></script>
<script type="text/javascript" src="js/jquery.jqcandlestick.min.js"></script>
2. Create a container for a chart.
<div id="demo"></div>
3. The basic CSS styles for the chart.
.jqcandlestick-container {
position: relative;
cursor: none;
}
.jqcandlestick-canvas {
position: absolute;
display: block;
height: 100%;
width: 100%;
}
4. Generate random data in the javascript only for example.
<script type="text/javascript">

var data = [];

var time = new Date('2013-12-01 12:00').valueOf();

var h = Math.floor(Math.random() * 100);
var l = h - Math.floor(Math.random() * 20);
var o = h - Math.floor(Math.random() * (h - l));
var c = h - Math.floor(Math.random() * (h - l));

var v = Math.floor(Math.random() * 1000);

for (var i = 0; i < 30; i++) {
  data.push([time, o, h, l, c, v]);
  h += Math.floor(Math.random() * 10 - 5);
  l = h - Math.floor(Math.random() * 20);
  o = h - Math.floor(Math.random() * (h - l));
  c = h - Math.floor(Math.random() * (h - l));
  v += Math.floor(Math.random() * 100 - 50);
  time += 30 * 60000; // Add 30 minutes
}
</script>
5. Call the plugin with options.
<script type="text/javascript">
$(function() {
$('#example-6').jqCandlestick({
data: data,
theme: 'light',
series: [{
type: 'candlestick',
color: '#00C',
}],
});
});
</script>
</script>
6. All the default settings.
series: [],
data: [],
theme: 'light', // light, dark
font: '8pt sans-serif',
padding: {
  top: 0,
  left: 10,
  bottom: 0,
  right: 0,
},
plot: {
  spacing: 5,
  padding: {
  top: 0,
  left: 15,
  bottom: 0,
  right: 15,
  },
},
xAxis: {
  name: 'DATE',
  months: ['Jan', 'Feb', 'Mar', 'Apr', 'May', 'Jun', 'Jul', 'Aug', 'Sep', 'Oct', 'Nov', 'Dec'],
  dataOffset: 0,
  min: null,
  max: null,
  minX: 0,
  maxX: 0,
  height: 20,
  color: '#333',
  strokeWidth: 1.0,
  tickSize: 5,
  labels: {
  font: null,
  color: '#999',
  format: 'date',
  },
},
yAxis: [{
  height: 1
}],
yAxisDefaults: {
  height: 1,
  color: '#222',
  strokeWidth: 1.0,
  numTicks: null,
  tickDistance: 40,
  labels: {
  font: null,
  color: '#999',
  format: {
  fixed: 2,
},
  },
},
seriesDefaults: {
  type: 'point', // point, line, column, and candlestick
  name: null,
  names: [],
  dataOffset: 1,
  yAxis: 0,
  color: '#fff',
},
info: {
  color: '#999',
  height: 20,
  font: null,
  spacing: 20,
  position: 'left', // 'left', 'right' or 'auto'
  wrap: 'auto', // 'auto', 'yes' or 'no'
  formatDate: function(date) {
  var year = date.getFullYear();
  var month = date.getMonth() + 1;
  if (month < 10)
  month = '0' + month;
  var day = date.getDate();
  if (day < 10)
  day = '0' + day;
  var hours = date.getHours();
  if (hours < 10)
  hours = '0' + hours;
  var minutes = date.getMinutes();
  if (minutes < 10)
  minutes = '0' + minutes;
  return year + '-' + month + '-' + day + ' ' + hours + ':' + minutes;

  },
},
cross: {
  color: 'rgba(255, 255, 255, 0.5)',
  strokeWidth: 1.0,
  text: {
  height: 20,
  background: '#000',
  font: null,
  color: '#999',
  },
},
containerClass: 'jqcandlestick-container',
chartCanvasAttrs: {
class: 'jqcandlestick-canvas',
},
crossCanvasAttrs: {
class: 'jqcandlestick-canvas',
},
Change log:
2014-01-03
- Fix date format in examples data generation
This awesome jQuery plugin is developed by nielssp. For more Advanced Usages, please check the demo page or visit the official website.


