Dynamic & Animated jQuery Bar Charts Plugin - LiveGraph
| File Size: | 77.4KB |
|---|---|
| Views Total: | 20544 |
| Last Update: | |
| Publish Date: | |
| Official Website: | Go to website |
| License: | MIT |
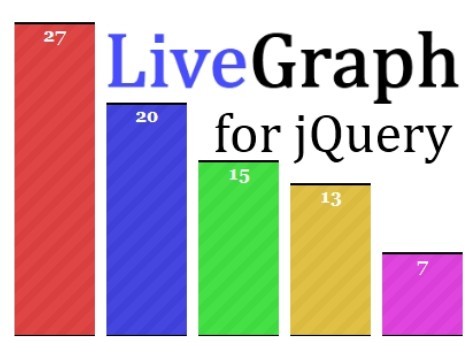
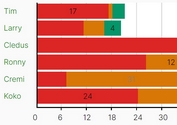
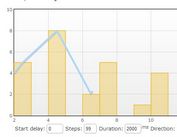
LiveGraph is a small jQuery graph plugin that dynamically generates live update bar charts from JSON data, html tables or ajax content.
Features:
- Dynamically adjustable bars for live update charts based on values changed
- Customizable bars
- Unlimited number of bars
- Animated bar moving
- Lightweight and easy to implement
Basic Usage:
1. Load the jQuery javascript and jQuery livegraph plugin in the head section
<script src="http://code.jquery.com/jquery-latest.min.js"></script>
<script type="text/javascript" src="jquery.livegraph.js"></script>
2. The CSS for the bar charts
background: url("diagonals_trans.png");
background-repeat: repeat;
color: #fff;
font-weight: bold;
font-size: 20px;
border: none !important;
border-bottom: 1px #000 solid !important;
border-top: 2px #000 solid !important;
}
div.liveGraph div.bars div[bar="tb3"] span {
background-color: #f00;
} /* ONLY MATCHES THE FIRST BAR */
div.liveGraph div.bars div[bar="tb2"] span {
background-color: #00f;
} /* ONLY MATCHES THE SECOND BAR */
div.liveGraph div.bars div[bar="tb1"] span {
background-color: #0f0;
} /* ONLY MATCHES THE THIRD BAR */
/* Other page styling */
3. Create bar charts from an HTML table
<table class="demo">
<thead>
<td>Bar</td>
<td>Value</td>
</thead>
<tr>
<td>Yes</td>
<td>50</td>
</tr>
<tr>
<td>No</td>
<td>50</td>
</tr>
<tr>
<td>Maybe</td>
<td>30</td>
</tr>
<tfoot>
<td colspan=2><button class="makeGraph">Make Graph</button></td>
</tfoot>
</table>
4. Or from JSON data
var data = {
  bar1: {
    label: "Bar 1",
    value: 2
  },
  bar2: {
    label: "Bar 2",
    value: 1
  },
  bar3: {
    label: "Bar 3",
    value: 3
  }
}
5. Create a container for the bar charts
<div id="page"></div>
6. Call the plugin with options
<script type="text/javascript">

$(document).ready(function() {
$('button.makeGraph').click(function() {
$('#page').liveGraph({
height : 350, // the maximum height for the entire chart
barWidth : 100, // the width of each bar
barGapSize : 2, // the spacing between bars
animate : true, // where animation should be enabled.
animTime : 2000, // the time taken for animation to complete, in milliseconds.
hideData : true, // whether to hide the data table or not. (true)
data : 'table.dataforgraph',
hideData : true // object OR string, the input data. If using string based CSS input, you must specify it as "table#id" or "table.class".
});

});
</script>
This awesome jQuery plugin is developed by lampieg. For more Advanced Usages, please check the demo page or visit the official website.
