Nice Configuarable Pie/Donut Chart with jQuery and D3.js - d3pie
| File Size: | 1.1 MB |
|---|---|
| Views Total: | 16506 |
| Last Update: | |
| Publish Date: | |
| Official Website: | Go to website |
| License: | MIT |

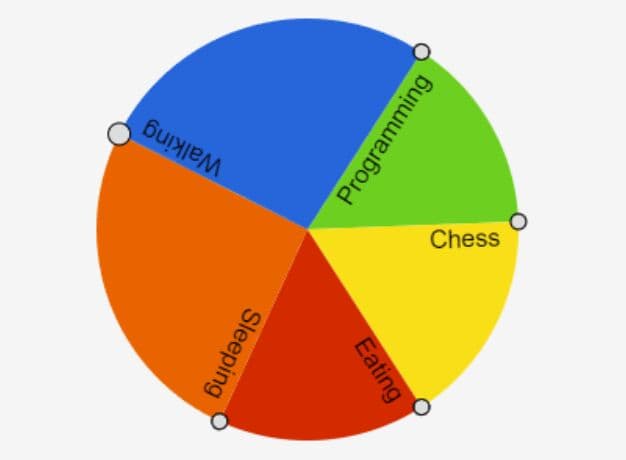
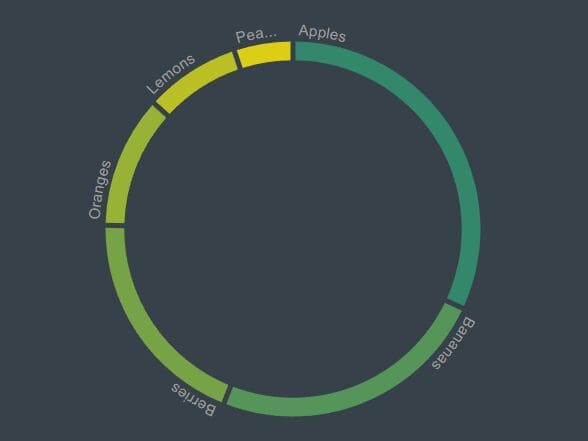
d3pie is a simple yet robust Javascript library that allows you to generate beautiful, interactive, attractive, animated and fully customizable pie / donut charts with the help of jQuery and D3.js.
Basic usage:
1. Load the D3.js JavaScript library and the d3pie.js in your document.
<script src="//cdnjs.cloudflare.com/ajax/libs/d3/4.13.0/d3.min.js"></script>
<script src="d3pie/d3pie.js"></script>
2. Create an empty DIV element that will be served as the container for the pie chart.
<div id="pie"></div>
3. Prepare your dataset and generate a basic pie chart.
var pie = new d3pie("pie", {
    header: {
      title: {
        text: "A Very Simple Pie",
        fontSize: 30
      }
    },
    data: {
      content: [
        { label: "JavaScript", value: 264131 },
        { label: "Ruby", value: 218812 },
        { label: "Java", value: 157618}
      ]
    }
});
4. All the default settings.
header: {
  title: {
    text:     "",
    color:    "#333333",
    fontSize: 18,
    font:     "arial"
  },
  subtitle: {
    text:     "",
    color:    "#666666",
    fontSize: 14,
    font:     "arial"
  },
  location: "top-center",
  titleSubtitlePadding: 8
},
footer: {
  text:     "",
  color:    "#666666",
  fontSize: 14,
  font:     "arial",
  location: "left"
},
size: {
  canvasHeight: 500,
  canvasWidth: 500,
  pieInnerRadius: "0%",
  pieOuterRadius: null
},
data: {
  sortOrder: "none",
  ignoreSmallSegments: {
    enabled: false,
    valueType: "percentage",
    value: null
  },
  smallSegmentGrouping: {
    enabled: false,
    value: 1,
    valueType: "percentage",
    label: "Other",
    color: "#cccccc"
  },
  content: []
},
labels: {
  outer: {
    format: "label",
    hideWhenLessThanPercentage: null,
    pieDistance: 30
  },
  inner: {
    format: "percentage",
    hideWhenLessThanPercentage: null
  },
  mainLabel: {
    color: "#333333",
    font: "arial",
    fontSize: 10
  },
  percentage: {
    color: "#dddddd",
    font: "arial",
    fontSize: 10,
    decimalPlaces: 0
  },
  value: {
    color: "#cccc44",
    font: "arial",
    fontSize: 10
  },
  lines: {
    enabled: true,
    style: "curved",
    color: "segment"
  },
  truncation: {
    enabled: false,
    length: 30
  }
},
effects: {
  load: {
    effect: "default",
    speed: 1000
  },
  pullOutSegmentOnClick: {
    effect: "bounce",
    speed: 300,
    size: 10
  },
  highlightSegmentOnMouseover: true,
  highlightLuminosity: -0.2
},
tooltips: {
  enabled: false,
  type: "placeholder", // caption|placeholder
  string: "",
  placeholderParser: null,
  styles: {
    fadeInSpeed: 250,
    backgroundColor: "#000000",
    backgroundOpacity: 0.5,
    color: "#efefef",
    borderRadius: 2,
    font: "arial",
    fontSize: 10,
    padding: 4
  }
},
misc: {
  colors: {
    background: null,
    segments: [
      "#2484c1", "#65a620", "#7b6888", "#a05d56", "#961a1a", "#d8d23a", "#e98125", "#d0743c", "#635222", "#6ada6a",
      "#0c6197", "#7d9058", "#207f33", "#44b9b0", "#bca44a", "#e4a14b", "#a3acb2", "#8cc3e9", "#69a6f9", "#5b388f",
      "#546e91", "#8bde95", "#d2ab58", "#273c71", "#98bf6e", "#4daa4b", "#98abc5", "#cc1010", "#31383b", "#006391",
      "#c2643f", "#b0a474", "#a5a39c", "#a9c2bc", "#22af8c", "#7fcecf", "#987ac6", "#3d3b87", "#b77b1c", "#c9c2b6",
      "#807ece", "#8db27c", "#be66a2", "#9ed3c6", "#00644b", "#005064", "#77979f", "#77e079", "#9c73ab", "#1f79a7"
    ],
    segmentStroke: "#ffffff"
  },
  gradient: {
    enabled: false,
    percentage: 95,
    color: "#000000"
  },
  canvasPadding: {
    top: 5,
    right: 5,
    bottom: 5,
    left: 5
  },
  pieCenterOffset: {
    x: 0,
    y: 0
  },
  cssPrefix: null
},
callbacks: {
  onload: null,
  onMouseoverSegment: null,
  onMouseoutSegment: null,
  onClickSegment: null
}
This awesome jQuery plugin is developed by d3pie. For more Advanced Usages, please check the demo page or visit the official website.