Select A Date Range From A Column Chart - DateRange UI
| File Size: | 16.8 KB |
|---|---|
| Views Total: | 808 |
| Last Update: | |
| Publish Date: | |
| Official Website: | Go to website |
| License: | MIT |
A greate alternative to a basic date range picker.
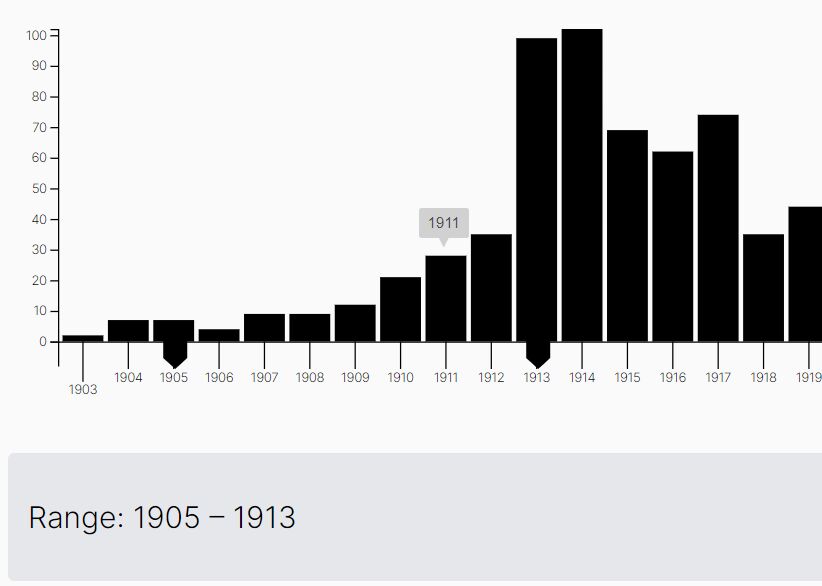
The DateRange UI jQuery plugin combines column chart and date range picker to provide a visual date selection UI.
Lightweight, animated, easy-to-use, fully responsive and touch friendly.
Built on top of jQuery and d3.js libraries.
How to use it:
1. Load the needed jQuery and d3.js libraries.
<script src="/path/to/cdn/jquery.min.js"></script>
<script src="/path/to/cdn/d3.min.js"></script>
2. Load the DateRange UI's script after jQuery.
<script src="plugin.js"></script>
3. Create an empety DIV to hold the column chart & date range picker.
<div id="graph"></div>
4. Prepare your time-series data for the column chart.
var myData = [
    {
      // year name
      "key_as_string":"1903",
      // value
      "doc_count":2,
      // unix timestamp in milliseconds
      "key":-2114384400000
    },
    {
      "key_as_string":"1904",
      "doc_count":7,
      "key":-2082848400000
    },
    // ...
]
5. Initialize the plugin to generate a column chart along with a custom date range picker at the bottom of it.
const graph = $("#graph").daterangeselect({
      data: myData,
      // more options here
});
6. Available options for the DateRange UI.
const graph = $("#graph").daterangeselect({
      data: myData,
      height: 320,
      rangeBarOpacity: 0.4,
      handleScaleFactor: 1.6,
      dataLengthTrigger: 30 // show tick values on x-axis for each bar or every 10th element
});
7. Override the default styles.
#graph {
  position: relative;
  width: 100%;
}

#range {
  color: #fff;
  font-size: 20px;
  background-color: #d81b60;
  padding: 5px 10px;
}

#graph text {
  fill: #ccc;
}

#graph tik {
  fill: #ccc;
}

#graph .domain, #graph line {
  stroke: #ccc;
}

#graph .bars .bar {
  fill: #bdb7b7;
}

#graph .bars .bar.highlight {
  fill: #d81b60 !important;
}

#graph .bars .axis--x path {
  display: none;
}

#graph .bars .bar.selected {
  fill: #fff;
}

#graph .handles .selector {
  fill: #fff;
  stroke: #777;
  stroke-width: 0.5px;
}

#graph .handles .selector.hovereffekt {
  stroke-width: 15px;
  stroke-opacity: 0.1;
  stroke: #eee;
}

#graph .handles .selector.active {
  fill: #ccc !important;
}

#graph .handles .range {
  fill: #fff; /* #d81b60 */
  stroke: none;
}

#graph .handles .selector .handlehovertext {
  fill: #fff;
  stroke: none;
  font-size: 11px;
  font-family: Helvetica, Arial;
}

#graph .empty line {
  stroke: #d81b60 !important;
}

#graph .empty text {
  /* fill: #d81b60 !important; */
}
8. Customize the tooltip displayed when you hover over the column chart.
#graph div.tooltip {
  position: absolute;
  text-align: center;
  width: 40px;
  height: 24px;
  padding-top: 5px;
  font: 12px sans-serif;
  background: #ccc;
  border: 0px;
  border-radius: 2px;
  pointer-events: none;
  color: #333;
}

#graph div.tooltip:after {
  box-sizing: border-box;
  display: inline;
  width: 100%;
  line-height: 1;
  color: #ccc;
  content: "\25BC";
  position: absolute;
  text-align: center;
  margin: -3px 0 0 0;
  top: 100%;
  left: 0;
}
9. Callback functions.
const graph = $("#graph").daterangeselect({
      data: myData,
      onRangeUpdate: function (obj) {
        //var myJSON = JSON.stringify(obj);
        //console.log("Clicked Section Data",obj);
      },
      hoverText: function (obj) {
        return obj.key_as_string;
      }
});
10. Update the column chart.
$("#graph").daterangeselect("update", newData);
This awesome jQuery plugin is developed by jpweinerdev. For more Advanced Usages, please check the demo page or visit the official website.