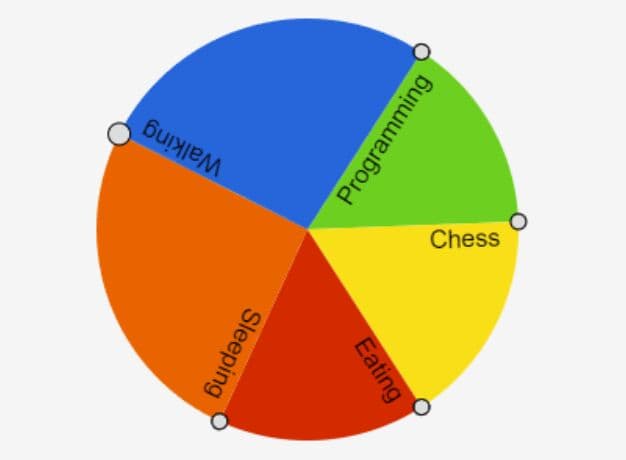
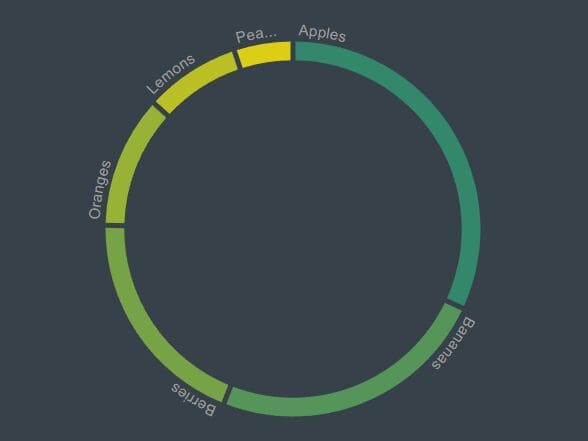
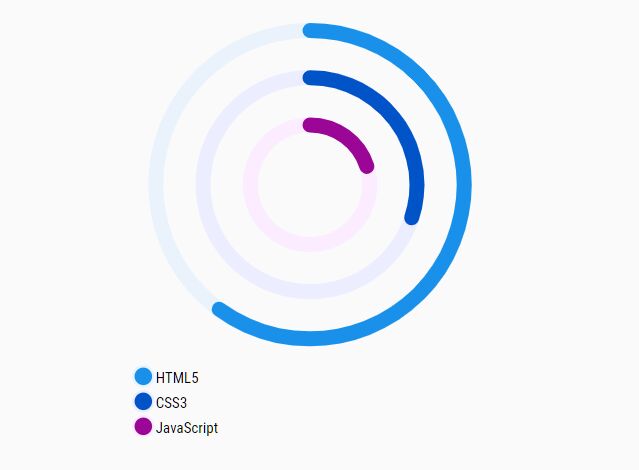
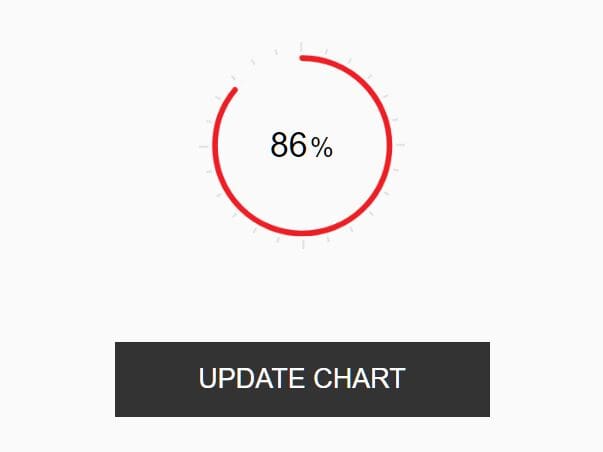
Dynamic Donut / Pie Chart Plugin with jQuery And D3.js - donut-pie-chart.js
| File Size: | 5.84 KB |
|---|---|
| Views Total: | 13891 |
| Last Update: | |
| Publish Date: | |
| Official Website: | Go to website |
| License: | MIT |
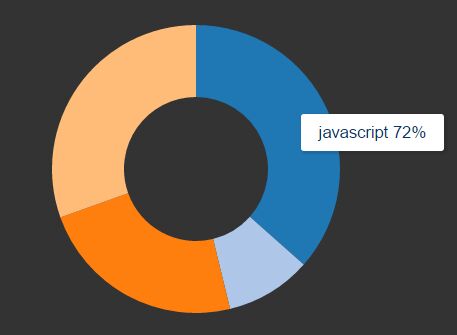
donut-pie-chart.js is a very small jQuery plugin that lets you render dynamic, animated, SVG-based donut / pie charts using d3.js library.
How to use it:
1. Load the necessary jQuery and D3.js JavaScript libraries in the webpage.
<script src="/path/to/jquery.min.js"></script>
<script src="/path/to/d3.min.js"></script>
2. Download and load the 'donut-pie-chart.js' script after jQuery.
<script src="donut-pie-chart.min.js"></script>
3. Create a container in which you want to render the donut / pie chart.
<div class="exp"></div>
4. Prepare your data you want to present.
var data = [
    {"name" : "JavaScript", "hvalue" : 20 },
    {"name" : "HTML5", "hvalue" : 2},
    {"name" : "CSS3", "hvalue" : 25},
    // assign a color if you'd like to or one would be set for you.
    {"name" : "Ruby", "hvalue" : 5, "color": "#00ff00" }
];
5. Initialize the plugin.
$(".exp").donutpie();
6. Update the chart with custom data.
$(".exp").donutpie('update', data);
7. Default options used to customize the plugin.
$(".exp").donutpie({
  radius: 240,
  tooltip : true,
  tooltipClass : "donut-pie-tooltip-bubble"
});
This awesome jQuery plugin is developed by screename. For more Advanced Usages, please check the demo page or visit the official website.