HTML Table Based Column Chart Plugin For jQuery - graph.js
| File Size: | Unknown |
|---|---|
| Views Total: | 13984 |
| Last Update: | |
| Publish Date: | |
| Official Website: | Go to website |
| License: | MIT |
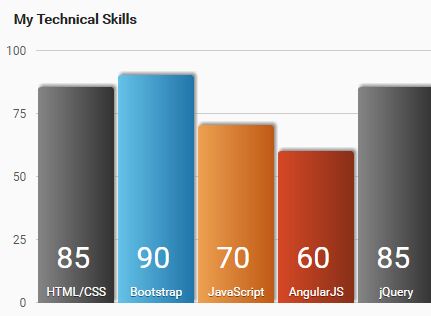
graph.js is a tiny and easy-to-use jQuery plugin that converts a data table into an animated column/bar chart with custom legends and percentage values.
How to use it:
1. Put the required CSS file bar.css in the head section of the webpage.
<link rel="stylesheet" href="css/bar.css">
2. Create a data table and insert the percentage values & legends into table cells as follows:
<div class="chart">
<h3>My Skills</h3>
<table id="data-table" border="1" cellpadding="10" cellspacing="0"
summary="Percentage of knowledge acquired during my experience
for each technology or language.">
<thead>
<tr>
<td> </td>
<th scope="col"></th>
</tr>
</thead>
<tbody>
<tr>
<th scope="row">HTML/CSS</th>
<td>85</td>
</tr>
<tr>
<th scope="row">Bootstrap</th>
<td>90</td>
</tr>
<tr>
<th scope="row">JavaScript</th>
<td>70</td>
</tr>
<tr>
<th scope="row">AngularJS</th>
<td>60</td>
</tr>
<tr>
<th scope="row">jQuery</th>
<td>85</td>
</tr>
<tr>
<th scope="row">Ajax</th>
<td>60</td>
</tr>
<tr>
<th scope="row">PHP</th>
<td>50</td>
</tr>
<tr>
<th scope="row">MySQL</th>
<td>60</td>
</tr>
<tr>
<th scope="row">ITIL</th>
<td>90</td>
</tr>
<tr>
<th scope="row">Scrum</th>
<td>90</td>
</tr>
</tbody>
</table>
</div>
3. Put both jQuery library and the jQuery graph.js plugin at the bottom of the webpage. That's it.
<script src="//code.jquery.com/jquery.min.js"></script>
<script src="js/graph.js"></script>
This awesome jQuery plugin is developed by atoyansk. For more Advanced Usages, please check the demo page or visit the official website.


