Scroll-triggered Animated Column Chart With jQuery And CSS3
| File Size: | 4.83 KB |
|---|---|
| Views Total: | 2747 |
| Last Update: | |
| Publish Date: | |
| Official Website: | Go to website |
| License: | MIT |
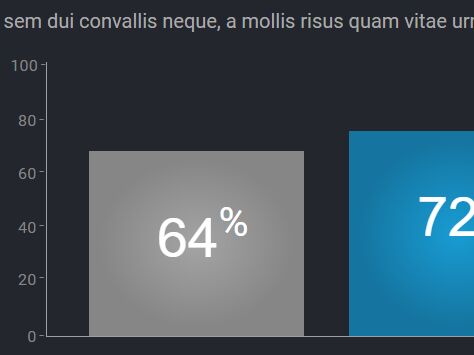
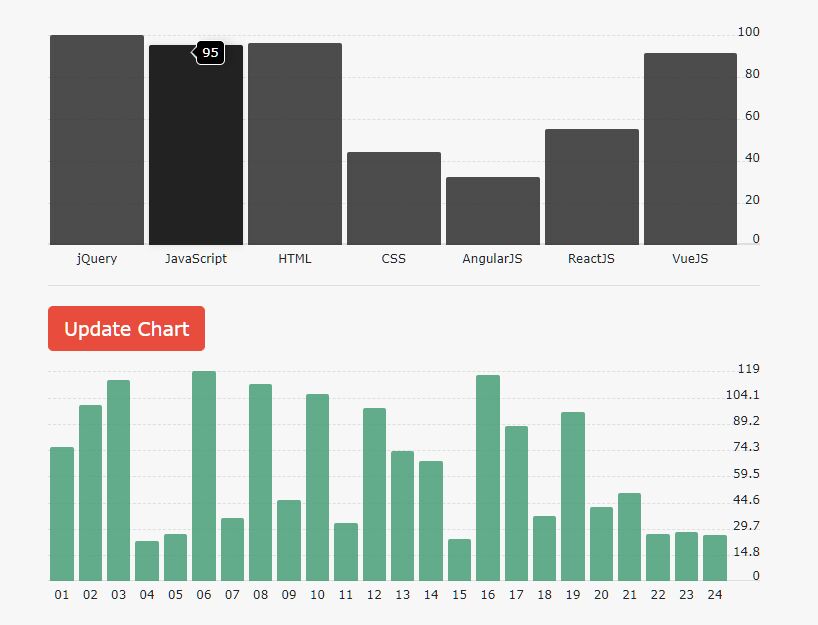
A tiny jQuery based animated percentage column chart that has the ability to animate the graphs when they scrolled into the viewport.
How to use it:
1. The html markup for the column chart.
<div class="graph-container">
  <div class="bar-overflow">
    <div class="graph-bar placebo-bar">
      <p>60<sup>%</sup></p>
    </div>
    <div class="graph-bar creon-bar">
      <p>40<sup>%</sup></p>
    </div>
  </div>
  <div class="y-axis-units">
    <p class="unit-100">100</p>
    <p class="unit-80">80</p>
    <p class="unit-60">60</p>
    <p class="unit-40">40</p>
    <p class="unit-20">20</p>
    <p class="unit-0">0</p>
  </div>
</div>
2. The required CSS to style the column chart.
.graph-container {
  height: 219px;
  width: 450px;
  border: 1px solid #a0a0a0;
  border-right: none;
  border-top: none;
  position: relative;
  margin-left: auto;
  margin-right: auto;
}

.graph-container .graph-bar {
  position: absolute;
  width: 162px;
  padding-top: 15px;
  padding-left: 10px;
  bottom: -100%;
}

.graph-container .graph-bar p {
  font-family: 'HelveticaNeueW01-75Bold', Arial, Helvetica, sans-serif;
  color: #ffffff;
  text-align: center;
  font-size: 44px;
  display: none;
  position: relative;
  top: -25px;
}

.graph-container .graph-bar.placebo-bar {
  background: -webkit-gradient(radial, center center, 0, center center, 100%, color-stop(0%, #a4a4a4), color-stop(60%, #868686), color-stop(100%, #868686));
  background: -webkit-radial-gradient(center, circle cover, #a4a4a4 0%, #868686 60%, #868686 100%);
  background: -webkit-radial-gradient(center circle, #a4a4a4 0%, #868686 60%, #868686 100%);
  background: radial-gradient(circle at center, #a4a4a4 0%, #868686 60%, #868686 100%);
  background: #868686;
  background: url(data:image/svg+xml;base64,PD94bWwgdmVyc2lvbj0iMS4wIiA/Pgo8c3ZnIHhtbG5zPSJodHRwOi8vd3d3LnczLm9yZy8yMDAwL3N2ZyIgd2lkdGg9IjEwMCUiIGhlaWdodD0iMTAwJSIgdmlld0JveD0iMCAwIDEgMSIgcHJlc2VydmVBc3BlY3RSYXRpbz0ibm9uZSI+CiAgPHJhZGlhbEdyYWRpZW50IGlkPSJncmFkLXVjZ2ctZ2VuZXJhdGVkIiBncmFkaWVudFVuaXRzPSJ1c2VyU3BhY2VPblVzZSIgY3g9IjUwJSIgY3k9IjUwJSIgcj0iNzUlIj4KICAgIDxzdG9wIG9mZnNldD0iMCUiIHN0b3AtY29sb3I9IiNhNGE0YTQiIHN0b3Atb3BhY2l0eT0iMSIvPgogICAgPHN0b3Agb2Zmc2V0PSI2MCUiIHN0b3AtY29sb3I9IiM4Njg2ODYiIHN0b3Atb3BhY2l0eT0iMSIvPgogICAgPHN0b3Agb2Zmc2V0PSIxMDAlIiBzdG9wLWNvbG9yPSIjODY4Njg2IiBzdG9wLW9wYWNpdHk9IjEiLz4KICA8L3JhZGlhbEdyYWRpZW50PgogIDxyZWN0IHg9Ii01MCIgeT0iLTUwIiB3aWR0aD0iMTAxIiBoZWlnaHQ9IjEwMSIgZmlsbD0idXJsKCNncmFkLXVjZ2ctZ2VuZXJhdGVkKSIgLz4KPC9zdmc+);
  left: 0;
  background-size: cover;
}

.graph-container .graph-bar.creon-bar {
  background: -webkit-gradient(radial, center center, 0, center center, 100%, color-stop(0%, #1996cb), color-stop(60%, #1575a0), color-stop(100%, #1575a0));
  background: -webkit-radial-gradient(center, circle cover, #1996cb 0%, #1575a0 60%, #1575a0 100%);
  background: -webkit-radial-gradient(center circle, #1996cb 0%, #1575a0 60%, #1575a0 100%);
  background: radial-gradient(circle at center, #1996cb 0%, #1575a0 60%, #1575a0 100%);
  background: #1575a0;
  background: url(data:image/svg+xml;base64,PD94bWwgdmVyc2lvbj0iMS4wIiA/Pgo8c3ZnIHhtbG5zPSJodHRwOi8vd3d3LnczLm9yZy8yMDAwL3N2ZyIgd2lkdGg9IjEwMCUiIGhlaWdodD0iMTAwJSIgdmlld0JveD0iMCAwIDEgMSIgcHJlc2VydmVBc3BlY3RSYXRpbz0ibm9uZSI+CiAgPHJhZGlhbEdyYWRpZW50IGlkPSJncmFkLXVjZ2ctZ2VuZXJhdGVkIiBncmFkaWVudFVuaXRzPSJ1c2VyU3BhY2VPblVzZSIgY3g9IjUwJSIgY3k9IjUwJSIgcj0iNzUlIj4KICAgIDxzdG9wIG9mZnNldD0iMCUiIHN0b3AtY29sb3I9IiMxODljZDMiIHN0b3Atb3BhY2l0eT0iMSIvPgogICAgPHN0b3Agb2Zmc2V0PSI2MCUiIHN0b3AtY29sb3I9IiMxNTc1YTAiIHN0b3Atb3BhY2l0eT0iMSIvPgogICAgPHN0b3Agb2Zmc2V0PSIxMDAlIiBzdG9wLWNvbG9yPSIjMTU3NWEwIiBzdG9wLW9wYWNpdHk9IjEiLz4KICA8L3JhZGlhbEdyYWRpZW50PgogIDxyZWN0IHg9Ii01MCIgeT0iLTUwIiB3aWR0aD0iMTAxIiBoZWlnaHQ9IjEwMSIgZmlsbD0idXJsKCNncmFkLXVjZ2ctZ2VuZXJhdGVkKSIgLz4KPC9zdmc+);
  background-size: cover;
}

.bar-overflow {
  overflow: hidden;
  position: relative;
  width: 450px;
  height: 207px;
  bottom: -12px;
}

.graph-container .y-axis-label {
  transform: rotate(-90deg);
  -ms-transform: rotate(-90deg);
  -webkit-transform: rotate(-90deg);
  -moz-transform: rotate(-90deg);
  position: absolute;
  top: 45px;
  left: -62px;
}

.graph-container .y-axis-label p {
  font-size: 10px;
  color: #004d71;
}

.graph-container .y-axis-units {
  position: absolute;
  bottom: -2px;
  left: -21px;
  height: 242px;
  width: 0;
}

.graph-container .y-axis-units p {
  font-size: 10px;
  color: #868686;
  text-align: right;
  margin-bottom: 0;
  position: absolute;
  width: 18px;
}

.graph-container .y-axis-units p.unit-100 {
  top: -1px;
  left: -1px;
}

.graph-container .y-axis-units p.unit-80 { top: 23px; }

.graph-container .y-axis-units p.unit-60 { top: 46px; }

.graph-container .y-axis-units p.unit-40 { top: 69px; }

.graph-container .y-axis-units p.unit-20 { top: 91px; }

.graph-container .y-axis-units p.unit-0 { bottom: -6px; }

.graph-container .y-axis-units p.unit-0:after { top: 2px; }

.graph-container .y-axis-units p:after {
  content: "\00af";
  position: relative;
  right: -2px;
  font-size: 9px;
  top: 1px;
}

.graph-container .graph-bar.placebo-bar { left: 34px; }

.graph-container .graph-bar.creon-bar { left: 242px; }

.graph-container .y-axis-label {
  top: 85px;
  left: -79px;
}

.graph-container .y-axis-label p { font-size: 13px; }

.graph-container .y-axis-units {
  left: -29px;
  bottom: -4px;
  height: 242px;
}

.graph-container .y-axis-units p {
  font-size: 13px;
  width: 25px;
}

.graph-container .y-axis-units p.unit-100 {
  top: -1px;
  left: 0;
}

.graph-container .y-axis-units p.unit-80 { top: 43px; }

.graph-container .y-axis-units p.unit-60 { top: 85px; }

.graph-container .y-axis-units p.unit-40 { top: 128px; }

.graph-container .y-axis-units p.unit-20 { top: 170px; }

.graph-container .y-axis-units p.unit-0 { bottom: -7px; }

.graph-container .y-axis-units p.unit-0:after { top: 2px; }
3. Include the latest version of the jQuery library at the bottom of the webpage.
<script src="//code.jquery.com/jquery-3.2.0.min.js"></script>
4. The core jQuery script to active the column chart.
var $win = $(window),
    $win_height = $(window).height(),
    windowPercentage = ($(window).height() * 1.4) // - multiple of viewport height - The higher this number the sooner triggered.

$win.on('scroll', scrollReveal);

function scrollReveal() {
    var scrolled = $win.scrollTop();
    $(".graph-bar").each(function() {
        var $this = $(this),
            offsetTop = $this.offset().top;
        if (scrolled + windowPercentage > offsetTop || $win_height > offsetTop) {
            var mql = window.matchMedia("screen and (min-width: 100px)") // Placeholder media query
            if (mql.matches) { // if media query matches
                var height1 = $(this).find("p").text(); // Getting the bar % from the text in the P
                var height2 = height1.substr(0, 2); // using only the first 2 chars
                var height3 = height2 * 2.07; // converting % to px - 206px is the height of the graph box - i.e. a 100% bar
            } else {
                var height1 = $(this).find("p").text(); // Getting the bar % from the text in the P
                var height2 = height1.substr(0, 2); // using only the first 2 chars
                var height3 = height2 * 1.15; // converting % to px - 206px is the height of the graph box - i.e. a 100% bar
            }
            $(this).css("height", height3);
            $(this).animate({
                'bottom': 0
            }, 1000, function() {
                $(this).find("p").fadeIn(800);
            });
        }
    });
}

scrollReveal();
This awesome jQuery plugin is developed by EricPorter. For more Advanced Usages, please check the demo page or visit the official website.