Github-like Interactive Data Heatmaps using jQuery - Heatmap.js
| File Size: | 25.9 KB |
|---|---|
| Views Total: | 497 |
| Last Update: | |
| Publish Date: | |
| Official Website: | Go to website |
| License: | MIT |

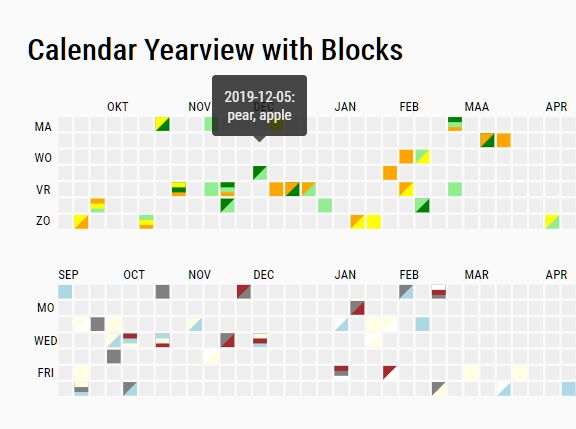
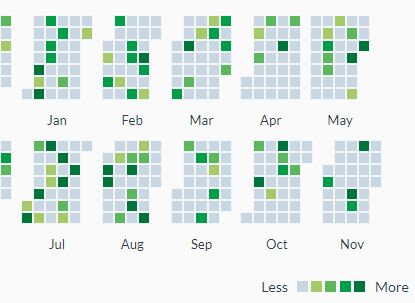
The jQuery Heatmap plugin enables you to create data visualizations similar to GitHub's contribution calendar. It transforms your data into an interactive heatmap where color intensities represent data values, perfect for tracking activities, contributions, or any time-series data.
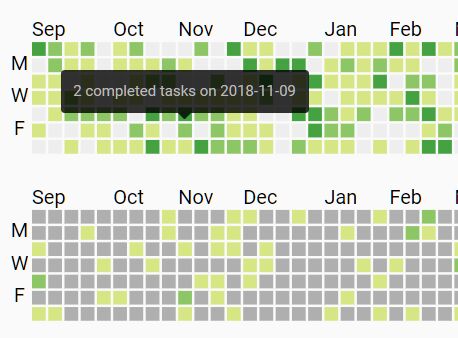
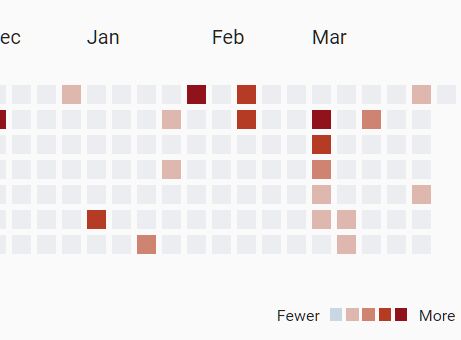
This plugin takes your time-series data and creates a calendar-style visualization. Each cell in the calendar represents a day, with color intensities mapping to your data values. The darker the color, the higher the value - giving users an immediate visual understanding of patterns and trends.
The Heatmap supports both static data arrays and dynamic data loading through AJAX requests. It automatically handles dates, adapts to different locales, and provides interactive tooltips. For organizations tracking user engagement, developer contributions, or any temporal data, this visualization presents complex information in a digestible format.
How to use it:
1. Make sure you have jQuery and moment.js libraries included in your project. Then, include the heatmap plugin's JavaScript file.
<script src="/path/to/cdn/jquery.min.js"></script>
<script src="/path/to/jquery.heatmap.js"></script>
<script src="/path/to/moment-with-locales.min.js"></script>
2. You need an HTML element where the heatmap will be rendered. A simple div will work.
<div id="example-heatmap"></div>
3. Initialize the heatmap on the container element and define your data as an array of objects. Each object should have a date and a count.
$('#example-heatmap').heatmap({
  data: [
    {date: '2025-01-01', count: 5},
    {date: '2025-01-02', count: 10},
    {date: '2025-01-03', count: 3},
    // more data here
  ],
});
4. For dynamic data, you can fetch it from an API endpoint. The plugin automatically appends startDate and endDate to the URL. You can add custom parameters using the queryParams function.
$('#example-heatmap').heatmap({
  data: '/path/to/api/data',
  queryParams: () => {
    return {
      // custom parameters
    };
  },
});
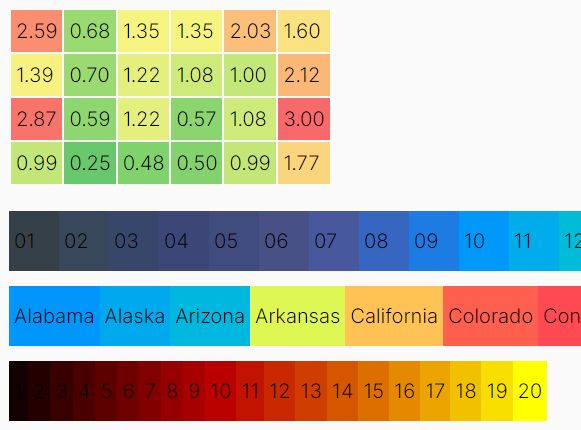
5. The plugin has a default color scale, but you can customize it by providing your own colors configuration. The keys represent the threshold percentage (from 0 to 1).
$('#example-heatmap').heatmap({
  colors: {
    0: '#ebedf0',
    0.25: '#c6e48b',
    0.5: '#7bc96f',
    0.75: '#239a3b',
    1: '#196127'
  },
});
6. Adapt the heatmap to different regional settings using the locale option. This affects the starting day of the week and date formatting.
$('#example-heatmap').heatmap({
  locale: 'de', // 'en', 'fr', etc
});
7. You can create interesting visualizations by mapping data to the shape of a word. This example shows how to generate data to spell "heatmap" on the calendar.
function generateHeatmapDataForWord() {
  const data = [];
  const year = 2024;
  const lowValue = 0;   // Background values

  // Grid definition for the word "Heatmap" - letters in a 7x52 layout (days/weeks)
  const heatmapWord = [
      "*  * **** ***                       ",
      "*  * *    *  * ***** M   M **** ****",
      "**** **** ****   *   MM MM *  * *  *",
      "*  * *    *  *   *   M M M **** **** ",
      "*  * **** *  *   *   M   M *  * *    ",
      "             *   *   M   M *  * *    ",
  ];

  // Set the start date
  let currentDate = new Date(`${year}-01-01`);

  let week = 0; // Calendar week
  while (week < heatmapWord[0].length && currentDate.getFullYear() === year) {
      for (let day = 0; day < 7 && currentDate.getFullYear() === year; day++) {
          // Check if there's a letter pixel at the current position
          const char = heatmapWord[day]?.[week] || " ";
          const count = char.trim() !== "" ? (Math.floor(Math.random() * 21) + 20) : lowValue; // High value for non-empty spaces

          data.push({
              date: currentDate.toISOString().split("T")[0],
              count: count,
          });

          // Move to the next day
          currentDate.setDate(currentDate.getDate() + 1);
      }
      week++;
  }

  return data;
}
$('#example-heatmap').heatmap({
  data: generateHeatmapDataForWord()
});
8. Further customize the heatmap's appearance and behavior with these options:
$('#example-heatmap').heatmap({
  debug: false,
  classes: 'border border-5 w-100 p-5',
  gutter: 2,
  cellSize: 14,
  titleFormatter(locale, date, count) {
    return date.toLocaleDateString() + ' - ' + count;
  },
});
9. Dynamically update the heatmap's options after it's initialized using the updateOptions method:
$('#example-heatmap').heatmap('updateOptions', {
  // options here
});
Changelog:
v1.0.4 (2025-01-25)
- Highlight today's date on the heatmap
v1.0.3 (2025-01-16)
- Remove `startDate` and `endDate` options for dynamic date handling
v1.0.2 (2025-01-15)
- Fix: Correct Data Mapping in Heatmap
This awesome jQuery plugin is developed by ThomasDev-de. For more Advanced Usages, please check the demo page or visit the official website.